This is the abridged developer documentation for Consibio Help Center
# Consibio Help Center
> Guides and answers for Consibio Cloud, devices and integrations.
Getting started New to Consibio Cloud? Set up your account, join a project and find your way around. [Start here](/cloud/getting-started/). Devices Claim, set up and troubleshoot your Consibio devices. [Claim a device](/cloud/devices/claiming-a-device/). Alarms Get notified when your measurements go out of range. [Create an alarm](/cloud/alarms/creating-an-alarm/). Team Work together: invite colleagues to your project and manage their roles. [Invite team members](/cloud/projects/inviting-team-members/).
# Creating an alarm
> Get notified when a measurement in your project goes out of range.
Alarms watch a measurement in your project and notify you when it crosses the limits you define — for example when a temperature gets too high or a tank level too low. ## Create an alarm [Section titled “Create an alarm”](#create-an-alarm) 1. Open the **Alarms** view from the main menu. 2. Select **Create alarm**. 3. Choose the element (measurement) the alarm should watch. 4. Set the limits that should trigger the alarm — for example an upper and/or lower threshold. 5. Choose who should be notified. Enable **Notify me** to receive notifications yourself. 6. Save the alarm. ## Alarm states [Section titled “Alarm states”](#alarm-states) In the Alarms view, each alarm shows its current state: | State | Meaning | | ------------ | --------------------------------------------------------------------------------------------- | | **OK** | The measurement is within limits. | | **Active** | The measurement is outside limits — the alarm has triggered and notifications have been sent. | | **Inactive** | The alarm is not currently evaluating (for example, its element has no recent data). | | **Disabled** | The alarm is switched off and will not trigger. | ## Tips [Section titled “Tips”](#tips) * Give alarms clear names — the name is what you’ll see in the notification. * Use **Disabled** instead of deleting an alarm you only need occasionally (for example during maintenance).
# Calibrating a sensor
> Adjust a sensor's readings in Consibio Cloud using the calibration tool, either by entering calibration points or a slope and offset.
Calibration lets you correct the values a sensor reports so they match a trusted reference — for example a hand-held meter, a laboratory result or a known reference concentration. In Consibio Cloud you calibrate the **element** that stores the measurement, and the calibration is automatically synced back to the device that produces the reading. Calibration works the same way for any calibratable element, whether it measures velocity, level, flow, H2S, temperature or something else. This article describes the shared calibration tool. ## Before you start [Section titled “Before you start”](#before-you-start) * You need **edit** permissions on the project. If you only have viewer or guest access, the tool tells you that you cannot change the calibration. * Decide how you want to calibrate: * **Calibration points** — enter one or more pairs of *measured* and *correct* values and let Consibio Cloud calculate the slope and offset for you. This is the recommended method for most sensors. * **Slope and offset** — enter the slope and offset directly, if you already know them. ## 1. Open the calibration tool [Section titled “1. Open the calibration tool”](#1-open-the-calibration-tool) 1. Open the **element** you want to calibrate to show its settings. 2. Find the **Calibration** row and select **Calibrate**. The button only appears for elements that support calibration. The calibration tool opens in a dialog. You are first asked to choose between **Enter calibration points** and **Enter slope and offset**. ## 2. Calibrate using calibration points [Section titled “2. Calibrate using calibration points”](#2-calibrate-using-calibration-points) Choose **Enter calibration points**. A chart of the element’s recent readings appears, with a time-range selector (for example **Last 1 day**) so you can zoom in on the period when the calibration was performed. Drag on the chart to zoom in, and double-click to reset the zoom. There are two ways to add a calibration point: * **Pick from the chart** — select a datapoint on the chart to add it as a calibration point. Select its marker again to remove it. This is handy when the sensor recorded known references earlier (for example while exposed to a calibration gas and then to fresh air). * **Add a point manually** — select **Add point** to add a row, then either type the value in **Measured value** or, if the sensor is reading a known reference right now, select **Update** on the row to pull in the element’s latest live reading. A row shows when the measured value was captured, or **Manual entry** if you typed it. For every point, enter the value the sensor *should* be reading in **Calibrated value** — the value from your reference (for example `500` for 500 ppm calibration gas, or `0` for fresh air). The number of points determines how the correction is calculated: * **1 point** — a simple offset. The correction shifts every reading by the difference between the measured and calibrated value. * **2 points** — a straight-line (linear) correction between the two points, giving both a slope and an offset. * **3 or more points** — a best-fit straight line (least-squares linear regression) through all the points. The **Confirm** button reflects what you have entered, for example *Confirm 2-point linear calibration*. ### Assume same zero-point [Section titled “Assume same zero-point”](#assume-same-zero-point) Under the calibration points there is an **Assume same zero-point** option. When enabled, the tool automatically adds a fixed point where a measured value of `0` equals a calibrated value of `0`. This turns a single entered point into a 2-point linear calibration through the origin. A row numbered **0** appears to show the added point; disable the option to remove it. Do not also enter a `0` value manually while this option is on — the tool needs each measured and calibrated value to be unique. ## 3. Calibrate using slope and offset [Section titled “3. Calibrate using slope and offset”](#3-calibrate-using-slope-and-offset) If you already know the correction, choose **Enter slope and offset** instead: * **Slope** — the factor the measured value is multiplied by to get the expected value. * **Offset** — the value added after multiplying, to get the expected value. The corrected value is calculated as `slope × measured + offset`. ## 4. Review and confirm [Section titled “4. Review and confirm”](#4-review-and-confirm) The **Coefficients** table shows the current **Slope** and **Offset** and, when your input changes them, the new values in green next to an arrow. Check that the new values look right, then select the **Confirm** (or **Save slope and offset**) button. The calibration is saved to the element and synced to the relevant device automatically. If the same calibration is changed in another window or session while you have the tool open, the tool warns you so you can re-check both the current and adjusted values before saving. ## Resetting a calibration [Section titled “Resetting a calibration”](#resetting-a-calibration) To remove a calibration and return the element to its default (no correction), open the calibration tool and select **Reset now** under the calibration options, then confirm. The button is disabled when the element is already at its default slope and offset. Caution Resetting a calibration cannot be undone. The current slope and offset are deleted. ## Troubleshooting [Section titled “Troubleshooting”](#troubleshooting) * **The Calibrate button is missing.** The element does not support calibration, or you do not have edit permissions on the project. * **The Confirm button stays disabled.** Make sure every measured and calibrated value is a valid, unique number. * **Values changed unexpectedly.** The calibration may have been updated in another session. Re-open the tool and check the **Coefficients** table before saving again. If you still can’t get the calibration to behave as expected, contact .
# Calibrating the H2S sensor
> Calibrate a Consibio H2S sensor against a calibration gas and fresh air, then apply the calibration in Consibio Cloud.
The Consibio H2S sensor is engineered for robustness and long-term stability. In most applications you don’t need to calibrate the sensor more than once or twice per year during service (which is part of the optional service agreement for the sensor). For applications that require the highest level of precision, you can calibrate the sensor whenever you want. This guide describes how. For the details of the calibration tool used in the last step, see [Calibrating a sensor](/cloud/devices/calibrating-a-sensor/). ## Preparations [Section titled “Preparations”](#preparations) ### Activate Deploy Mode [Section titled “Activate Deploy Mode”](#activate-deploy-mode) The first thing to do when you arrive on site is to activate **Deploy Mode** on the Logger: 1. Press **Restart** shortly. 2. Hold **Deploy Mode** for approximately 5s. When the LEDs flash quickly one at a time in a repeating pattern, Deploy Mode is activated. 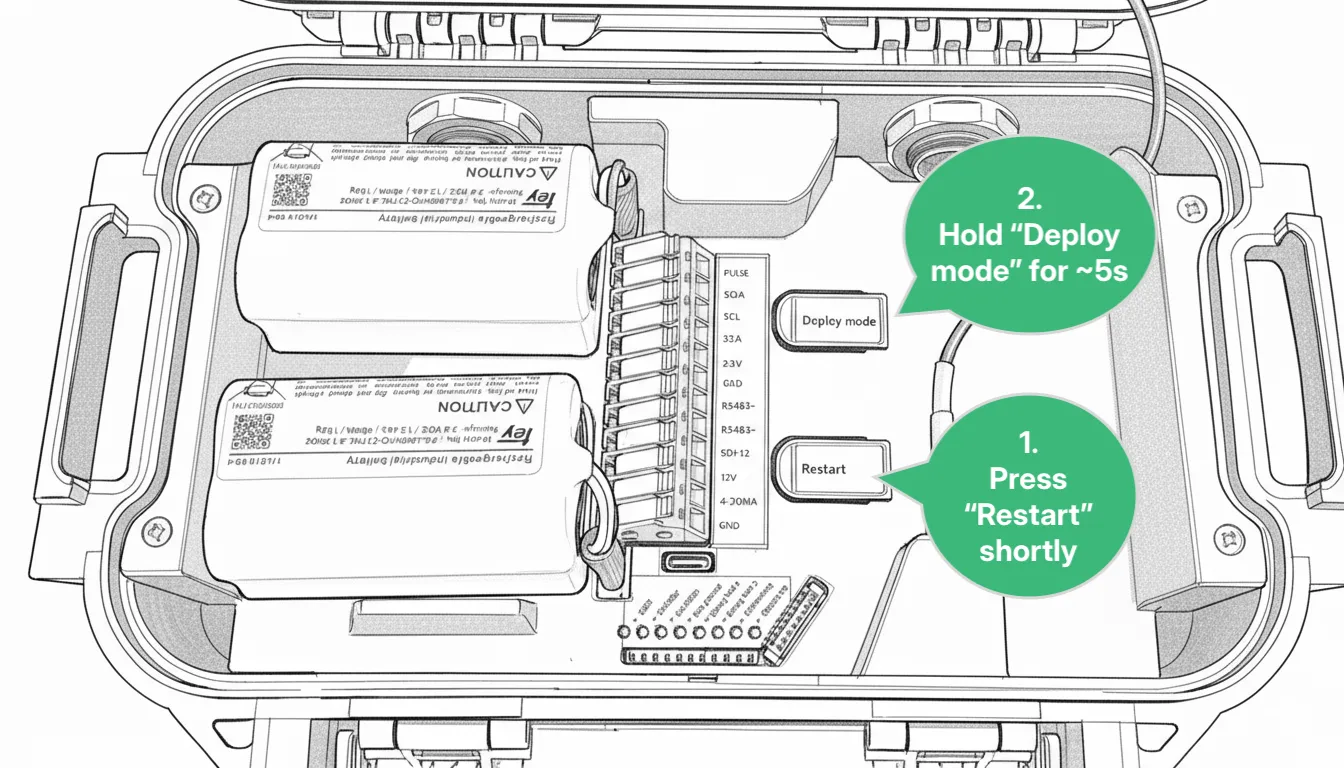 For the next **1 hour**, the device makes a **measurement every 30s** and **transmits every 5 mins**. After 1 hour, it reverts to the transmission and measurement interval configured in Consibio Cloud. Activate Deploy Mode first so the Logger starts measuring immediately and sends the data with minimal delay. ## Apply the calibration standard [Section titled “Apply the calibration standard”](#apply-the-calibration-standard) ### Ensure a stable baseline [Section titled “Ensure a stable baseline”](#ensure-a-stable-baseline) When the sensor is first connected, it takes a little time to reach equilibrium. If the sensor was just connected to a Logger, or the Logger was just powered up, wait at least **10 mins**. If the sensor has been connected for a while and the Logger is already powered up, you can skip this step. ### Apply gas from a cylinder with a calibration standard [Section titled “Apply gas from a cylinder with a calibration standard”](#apply-gas-from-a-cylinder-with-a-calibration-standard) If a cable hanger is attached, remove it first. 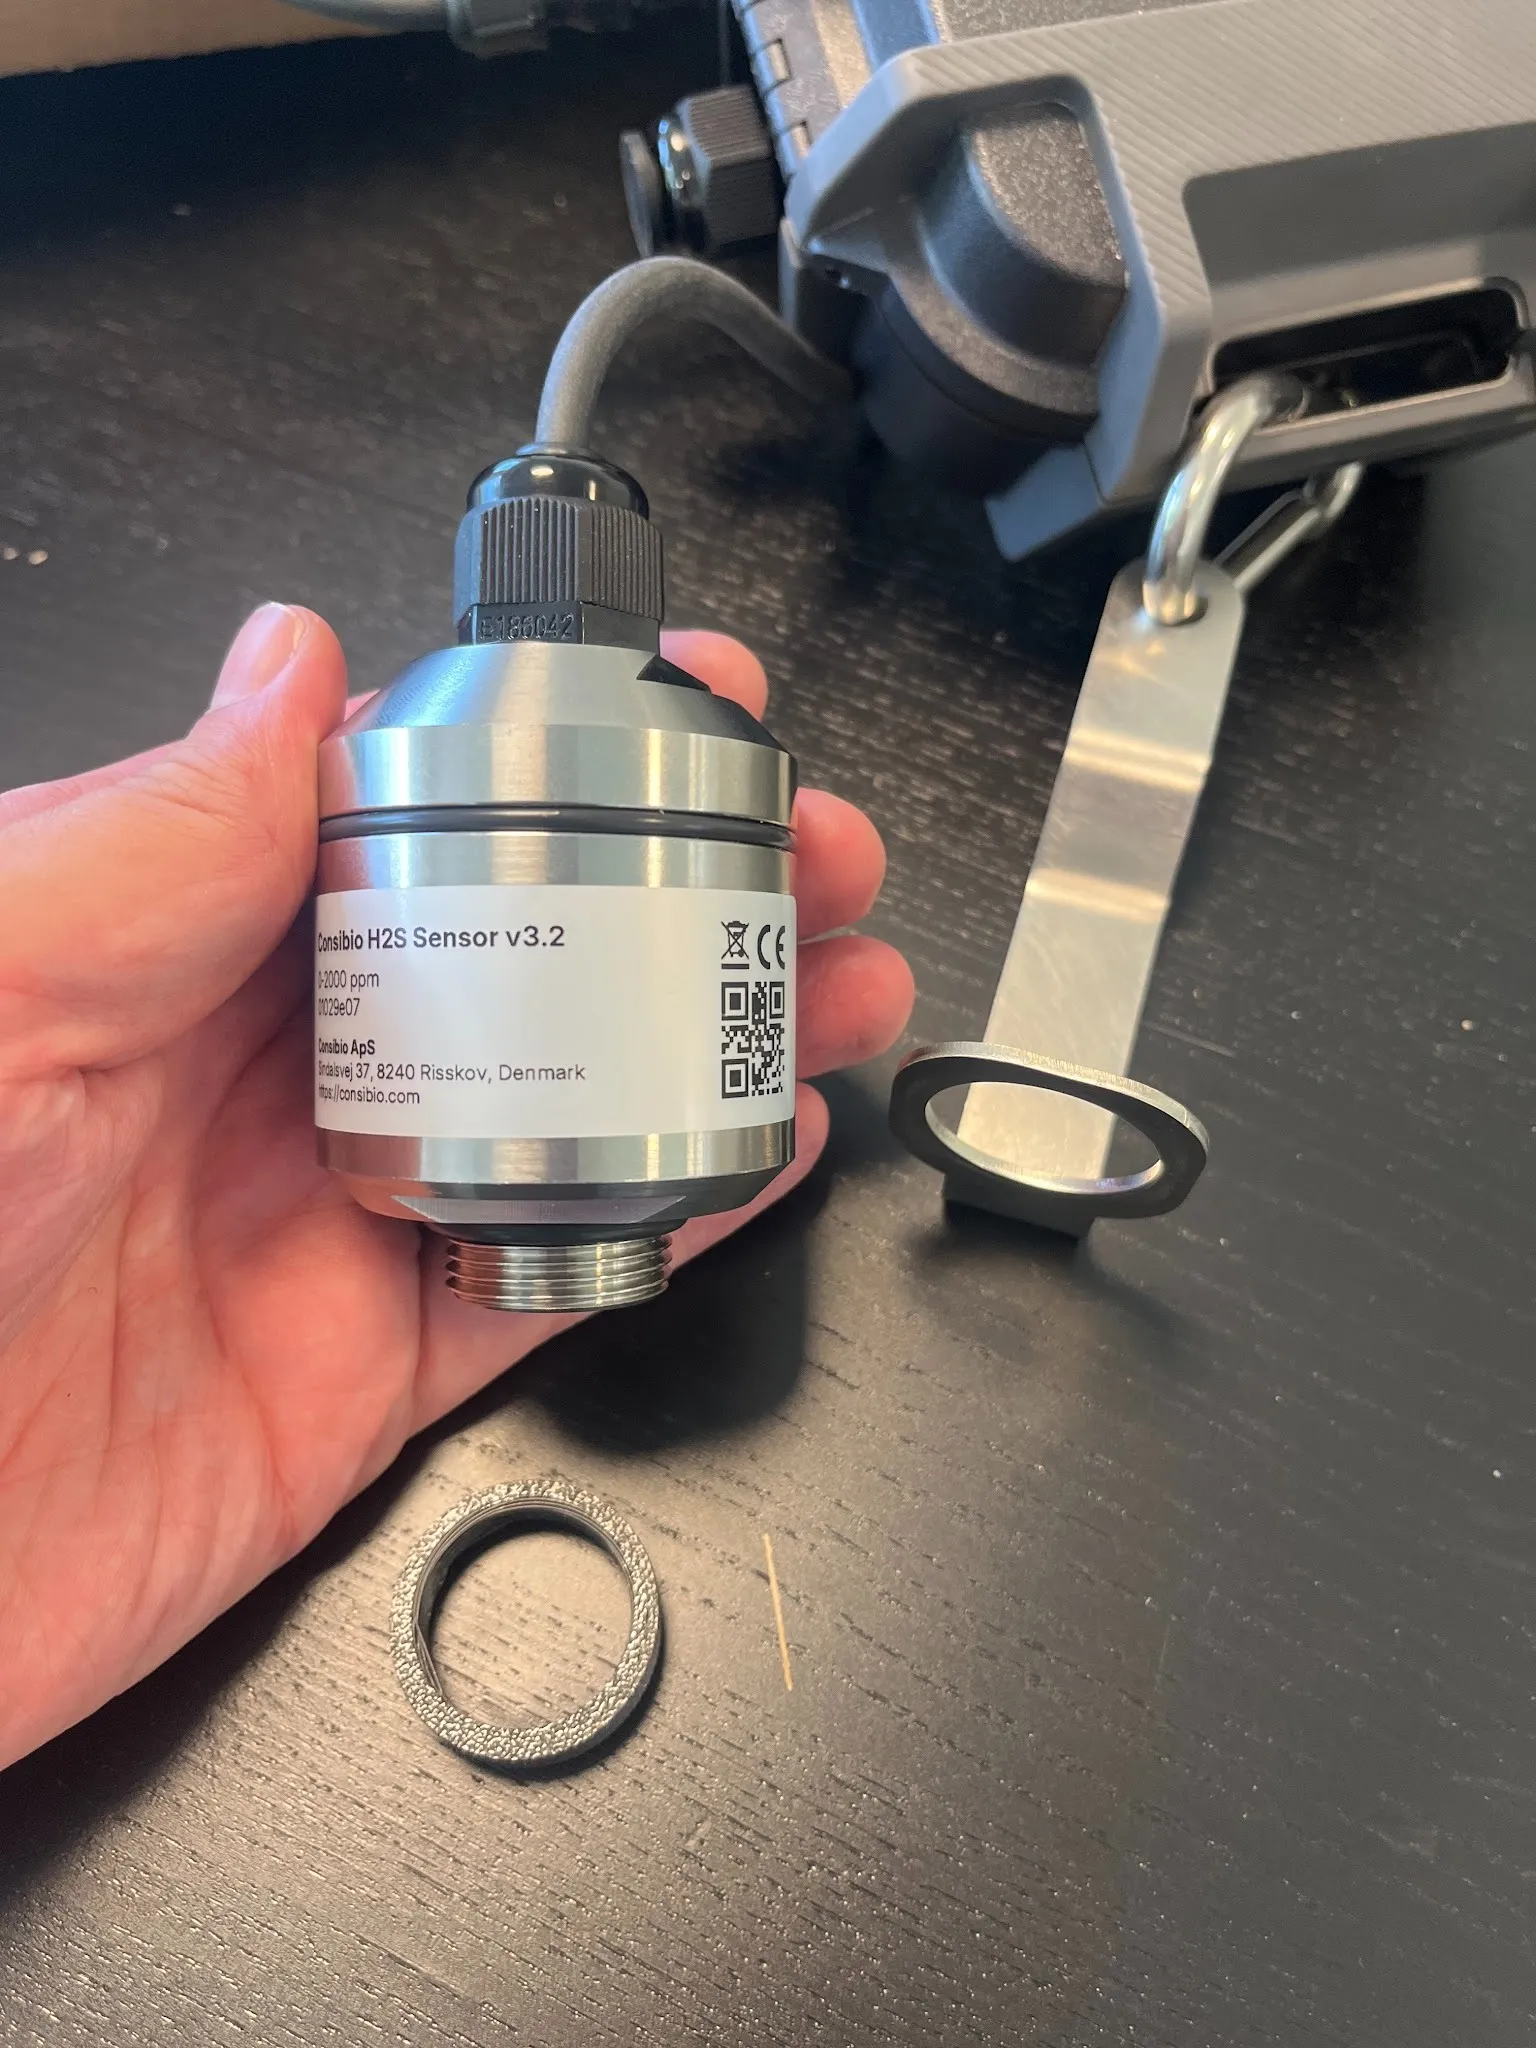 Attach the calibration header to the sensor. Calibration headers are available on request (). Connect a tube between the calibration header and a gas cylinder with a suitable calibration standard (for example 500 ppm H2S in air, or 50 ppm H2S in air). We recommend a regulator with a fixed gas flow between **0.2 and 0.5 L/min** during calibration. 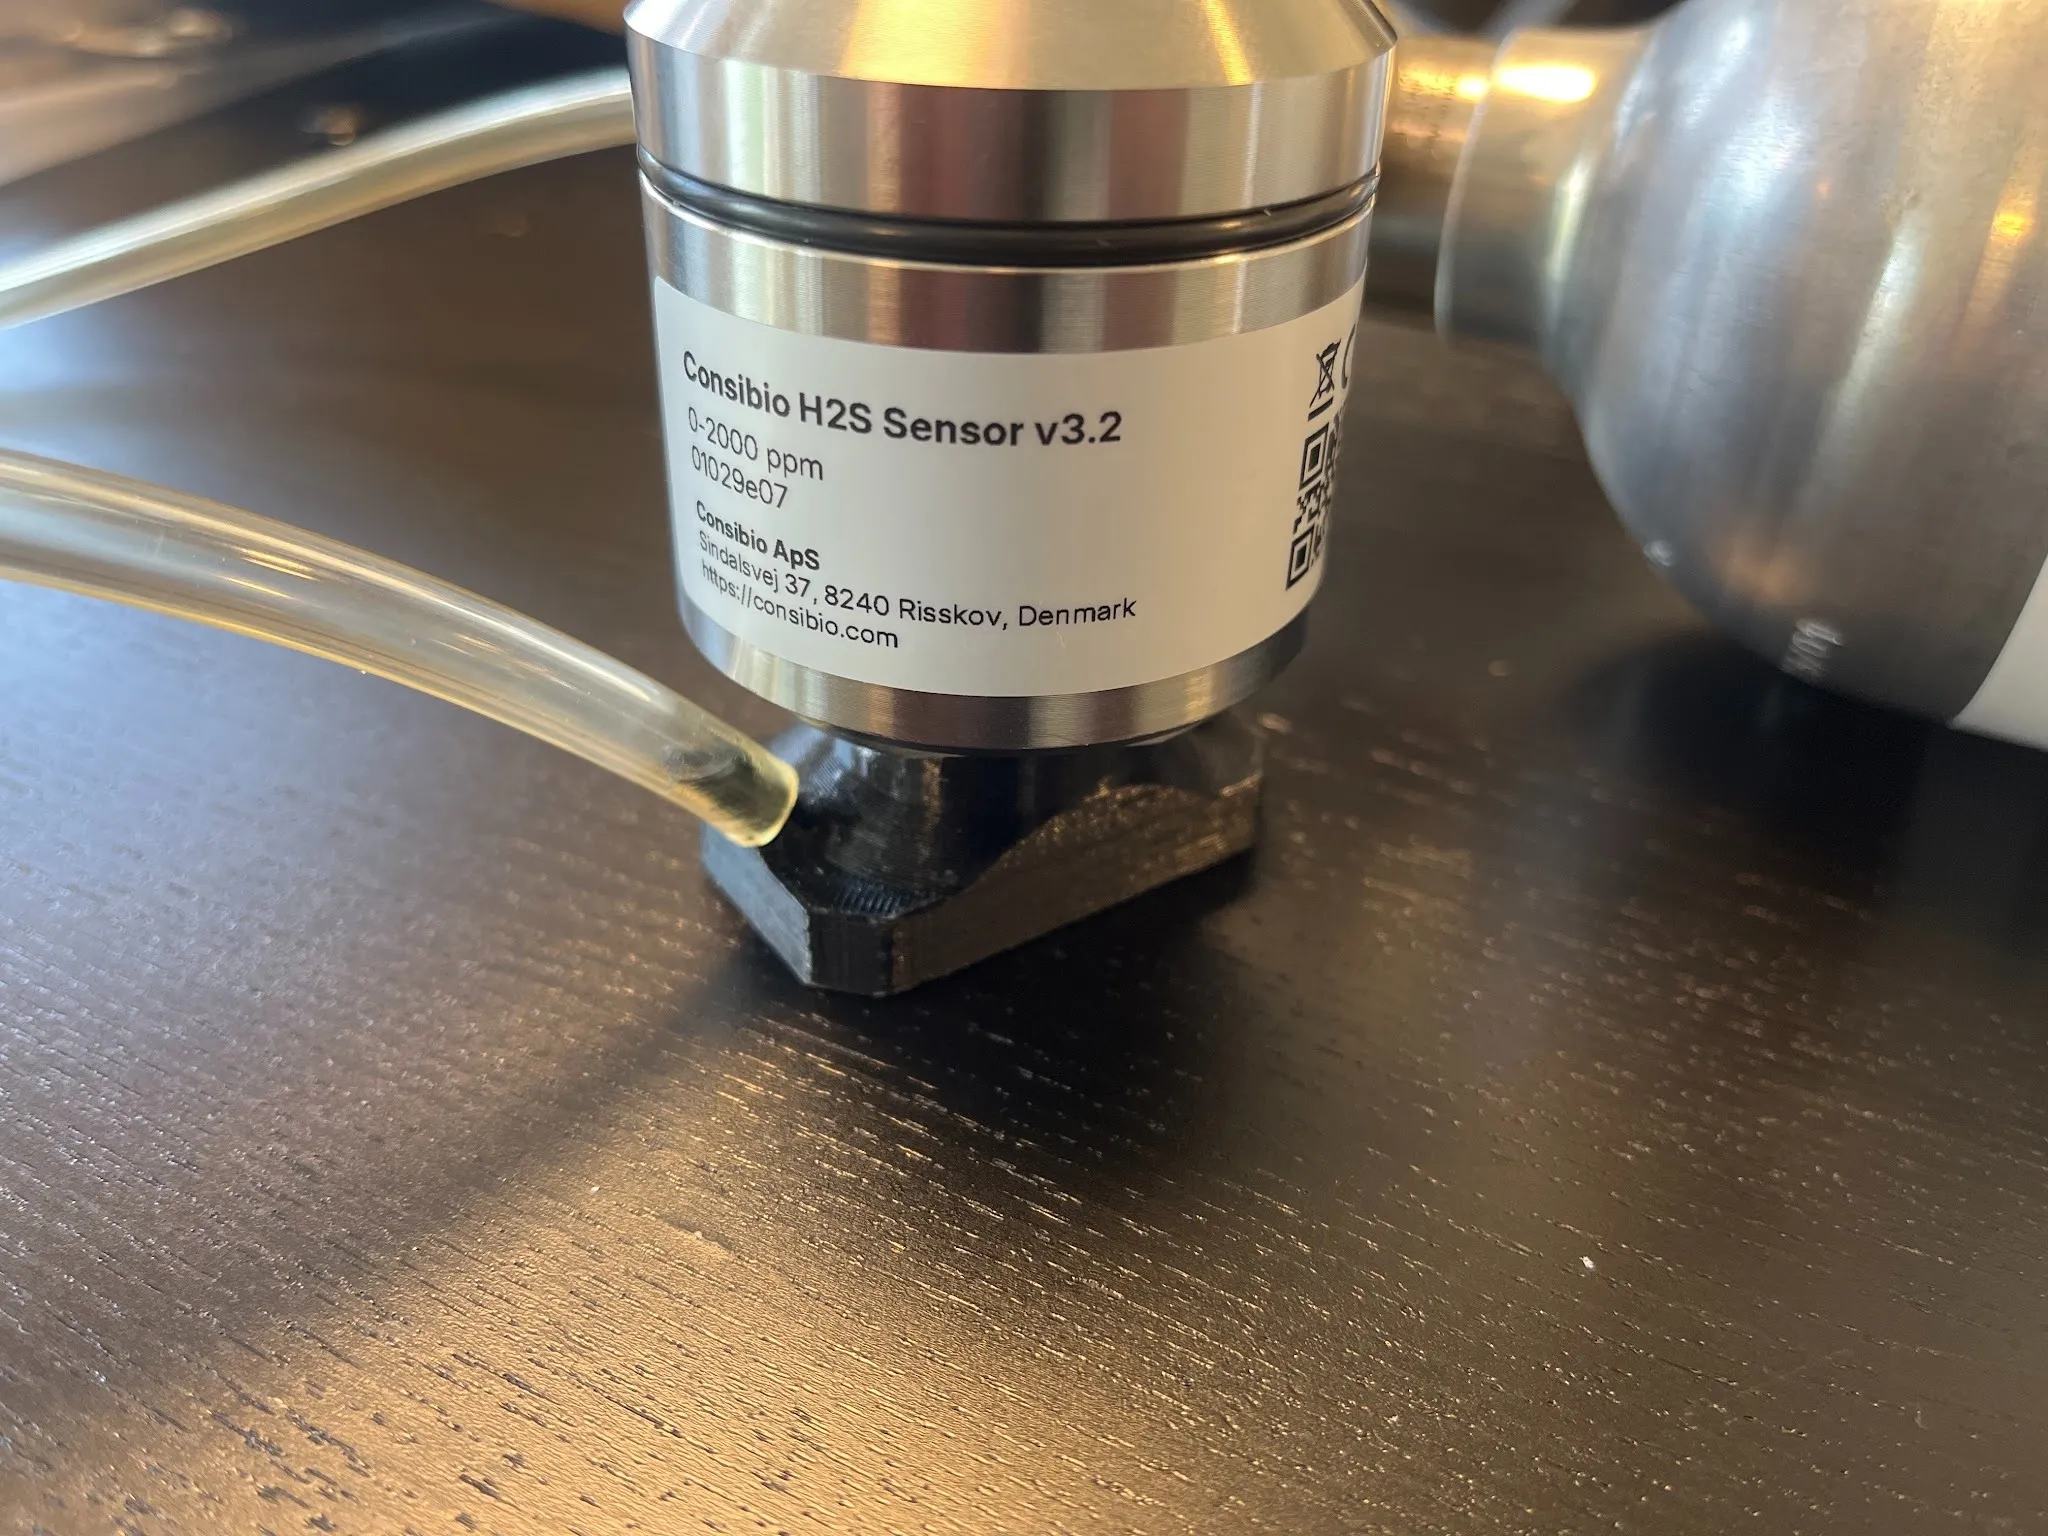 Open the valve on the gas cylinder and set a timer for **10 minutes** while the sensor measures the calibration gas. Caution H2S is highly toxic. Only apply calibration gas in a well-ventilated area — outdoors or in a suitable fume hood. ### Turn off the gas [Section titled “Turn off the gas”](#turn-off-the-gas) After 10 mins, turn off the gas and disconnect the sensor from the calibration header. Move the sensor into fresh air and wait another **10 minutes** while it collects a zero-point measurement. If you only want a 1-point calibration, you can skip this step to save time. ## Apply the calibration in Consibio Cloud [Section titled “Apply the calibration in Consibio Cloud”](#apply-the-calibration-in-consibio-cloud) Open the Consibio Cloud dashboard at [v3.consibio.cloud](https://v3.consibio.cloud) and log in to the project where the Logger is located. Go to the **Installations** tab and select the **H2S** parameter on the given location: 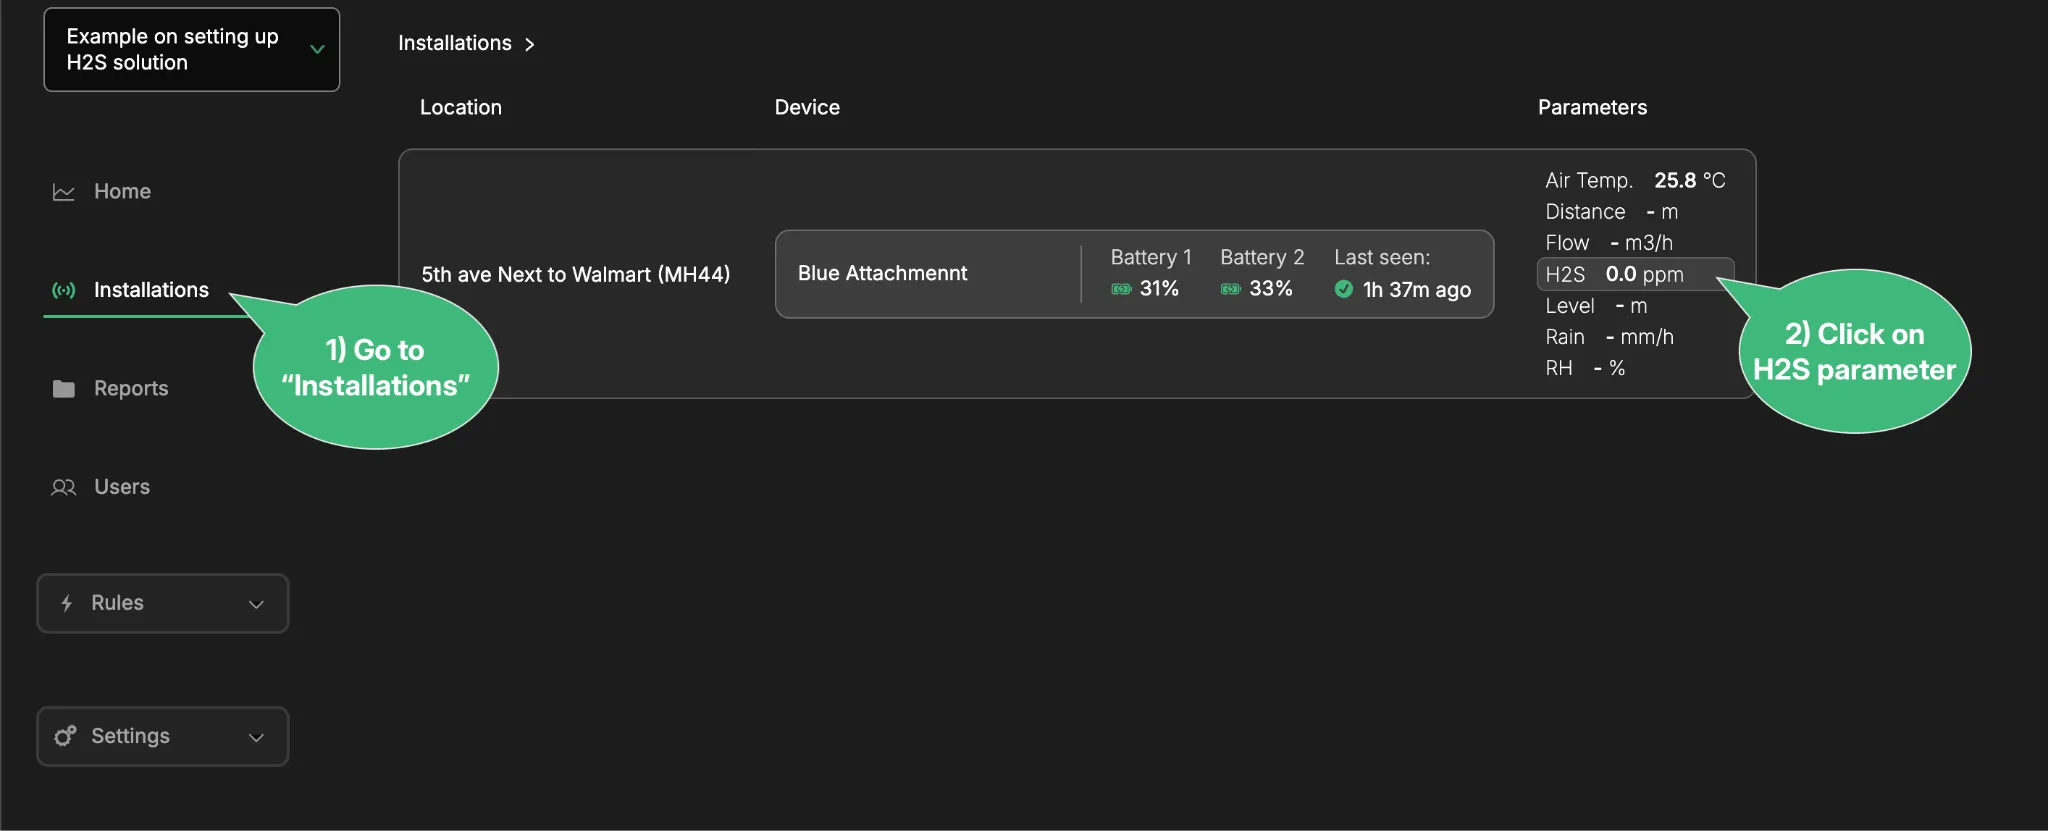 Select **Calibrate**: 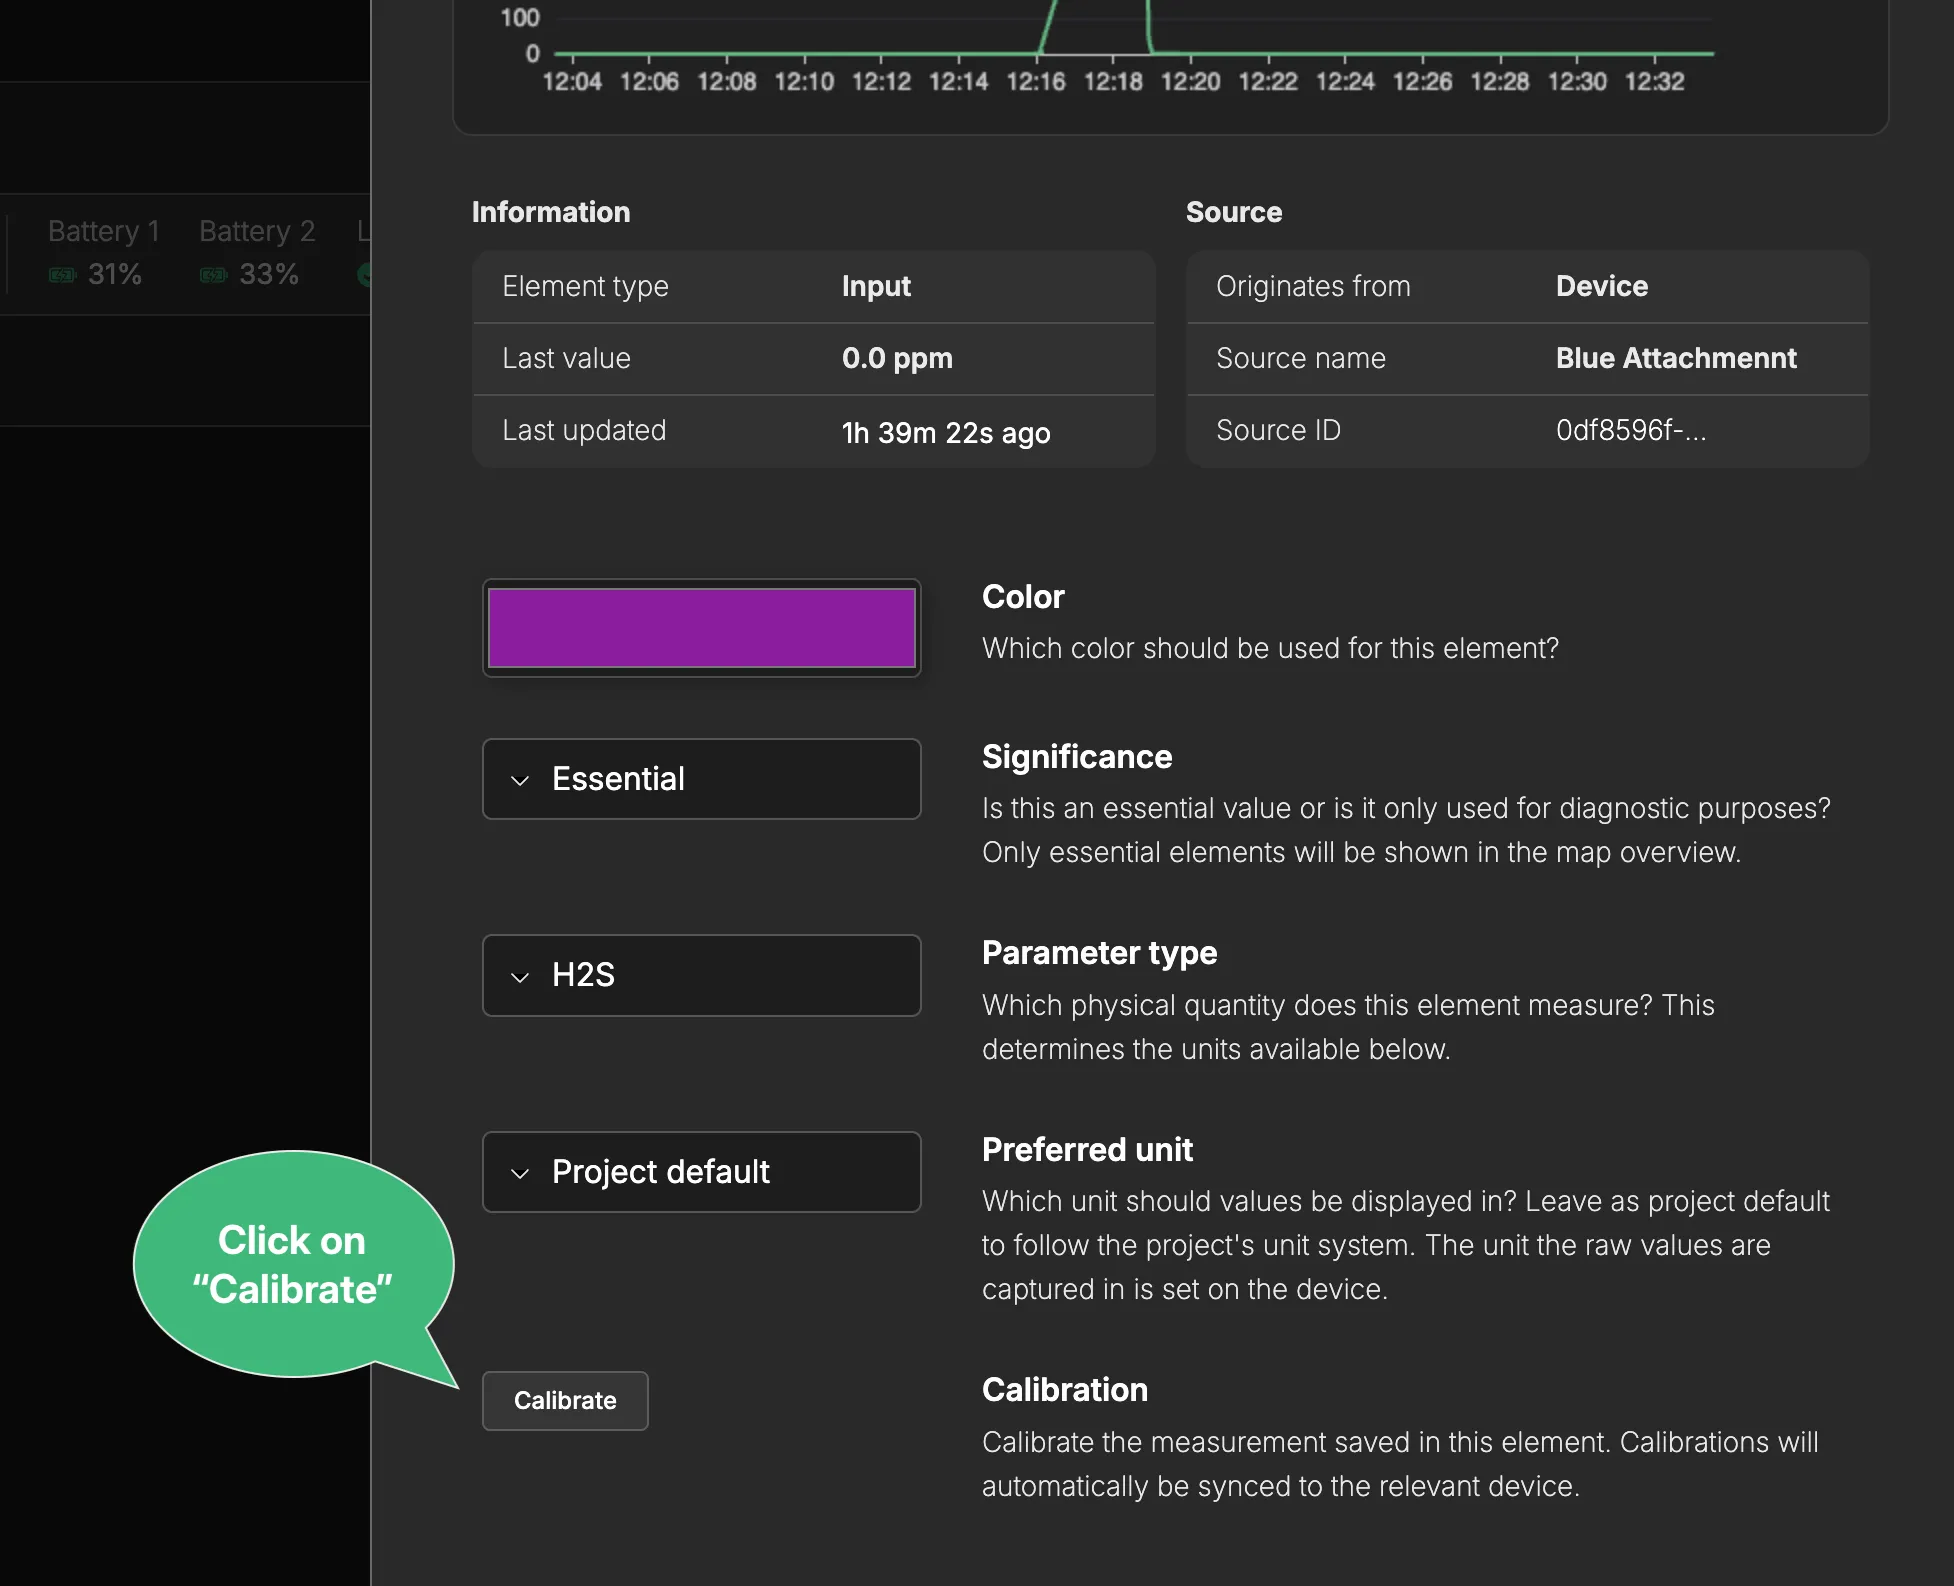 Select **Enter calibration points**: 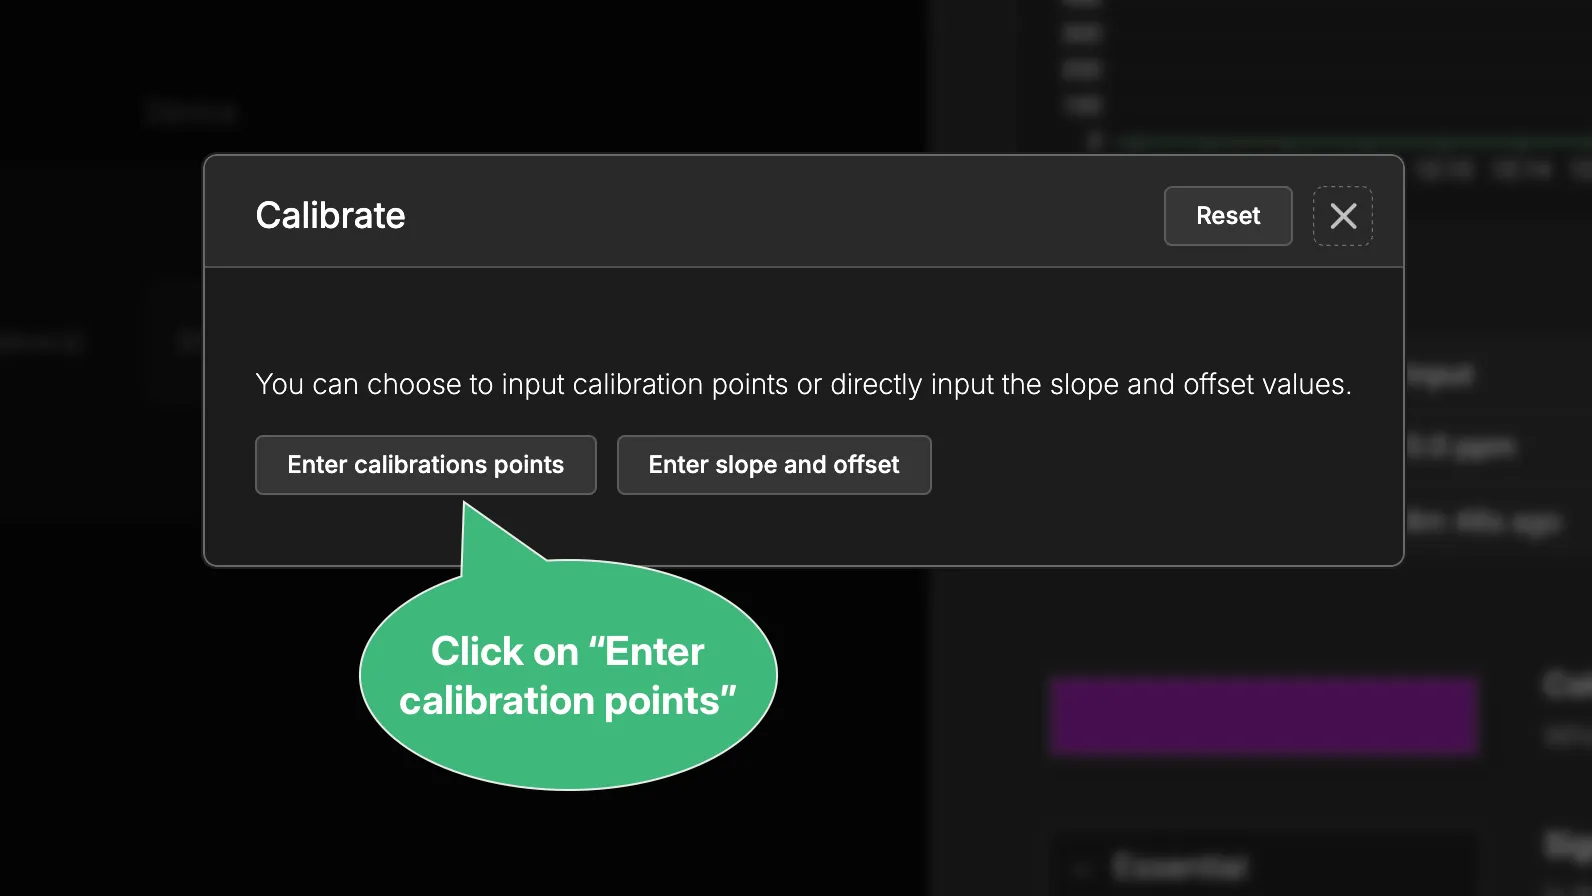 Select a time range in the chart that covers when the calibration was performed: 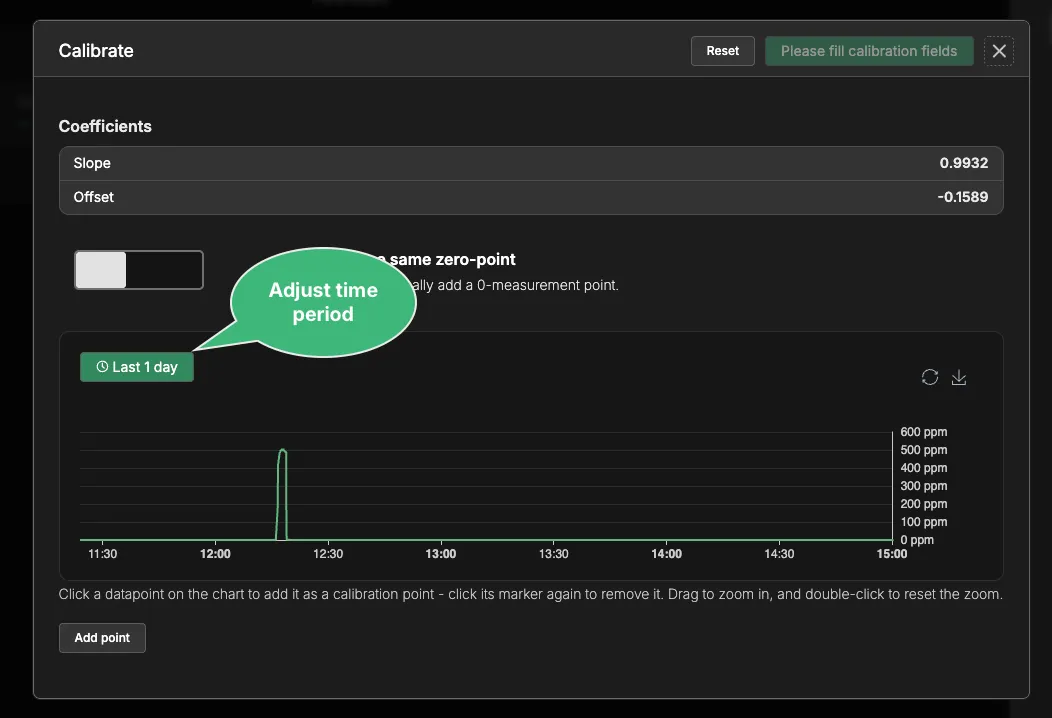 Mark the calibration points on the chart and enter the calibrated values: 1. Click the two datapoints where the sensor was reading the calibration gas and fresh air, respectively. Each becomes a calibration point row below the chart. 2. For the high point, change the **Calibrated value** to the value of the calibration gas (for example `500` ppm). 3. For the low point, change the **Calibrated value** to `0` (fresh air). 4. Select **Confirm** (for example **Confirm 2-point linear calibration**). 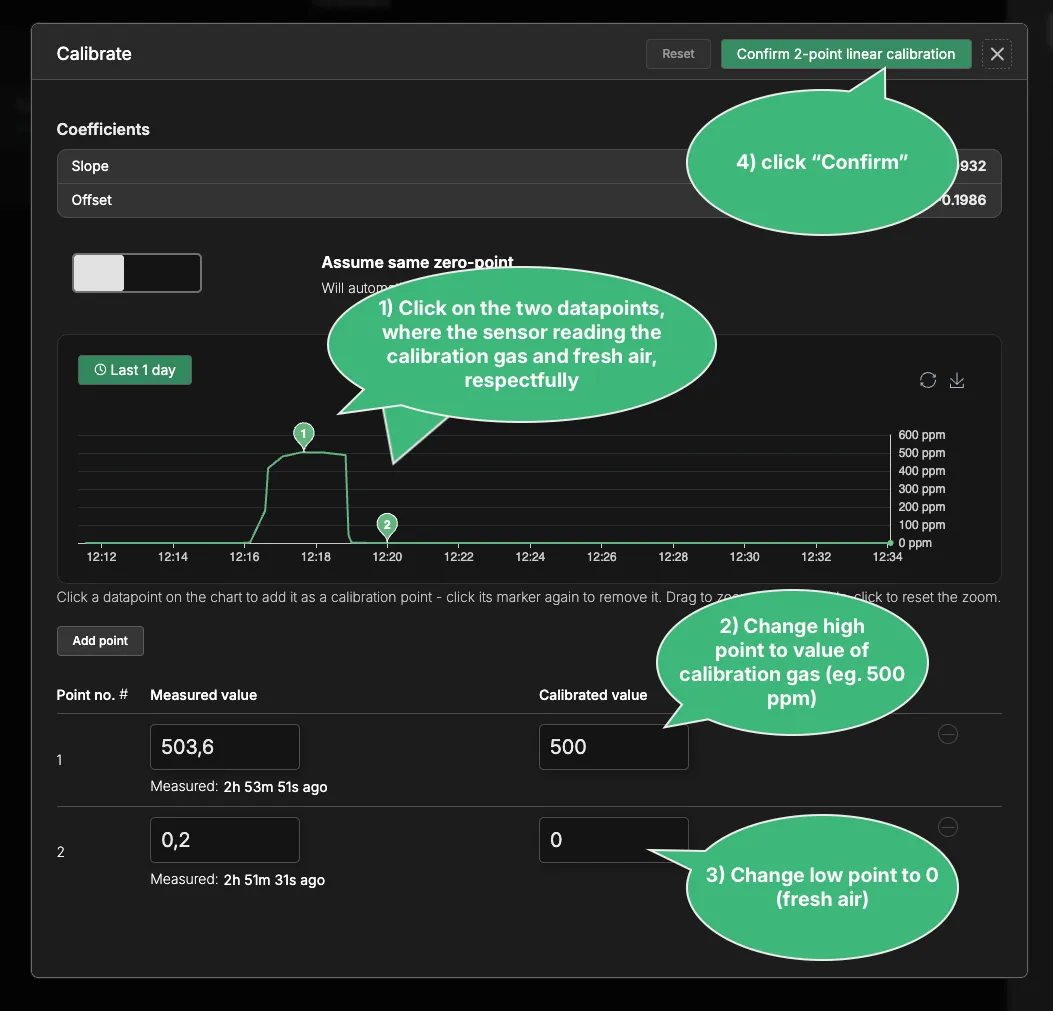 The calibration is automatically synchronized to the Logger, which saves it inside the sensor. Subsequent readings are then based on the applied calibration. If you have any questions, reach out to us at .
# Calibrating the MJK Phix pH probe
> Calibrate an MJK Phix pH probe against pH 7 and pH 4 buffer solutions while it is connected to a Consibio Logger.
pH sensors must be calibrated at regular intervals to provide an accurate reading. Follow the steps below to calibrate an MJK Phix pH probe while it is connected to a Consibio Logger. The calibration is performed on the probe itself, using the calibration ring and two buffer solutions. The Logger only needs to supply constant power while you work. ## What you need [Section titled “What you need”](#what-you-need) * Deionized water to rinse the probe. * A calibration buffer solution with **pH 7.0**. * A calibration buffer solution with **pH 4.0**. * A soft cloth that will not scratch the electrode. ## 1. Keep the Logger powered up [Section titled “1. Keep the Logger powered up”](#1-keep-the-logger-powered-up) During normal operation, the Logger powers the sensor up and down with every measurement to preserve battery. That interferes with the calibration procedure, so put the Logger into a configuration where it stays online: 1. Open the device in Consibio Cloud, set the **Transmission interval** to **0** seconds and select **Save**. At `0s`, the device attempts to stay online indefinitely. 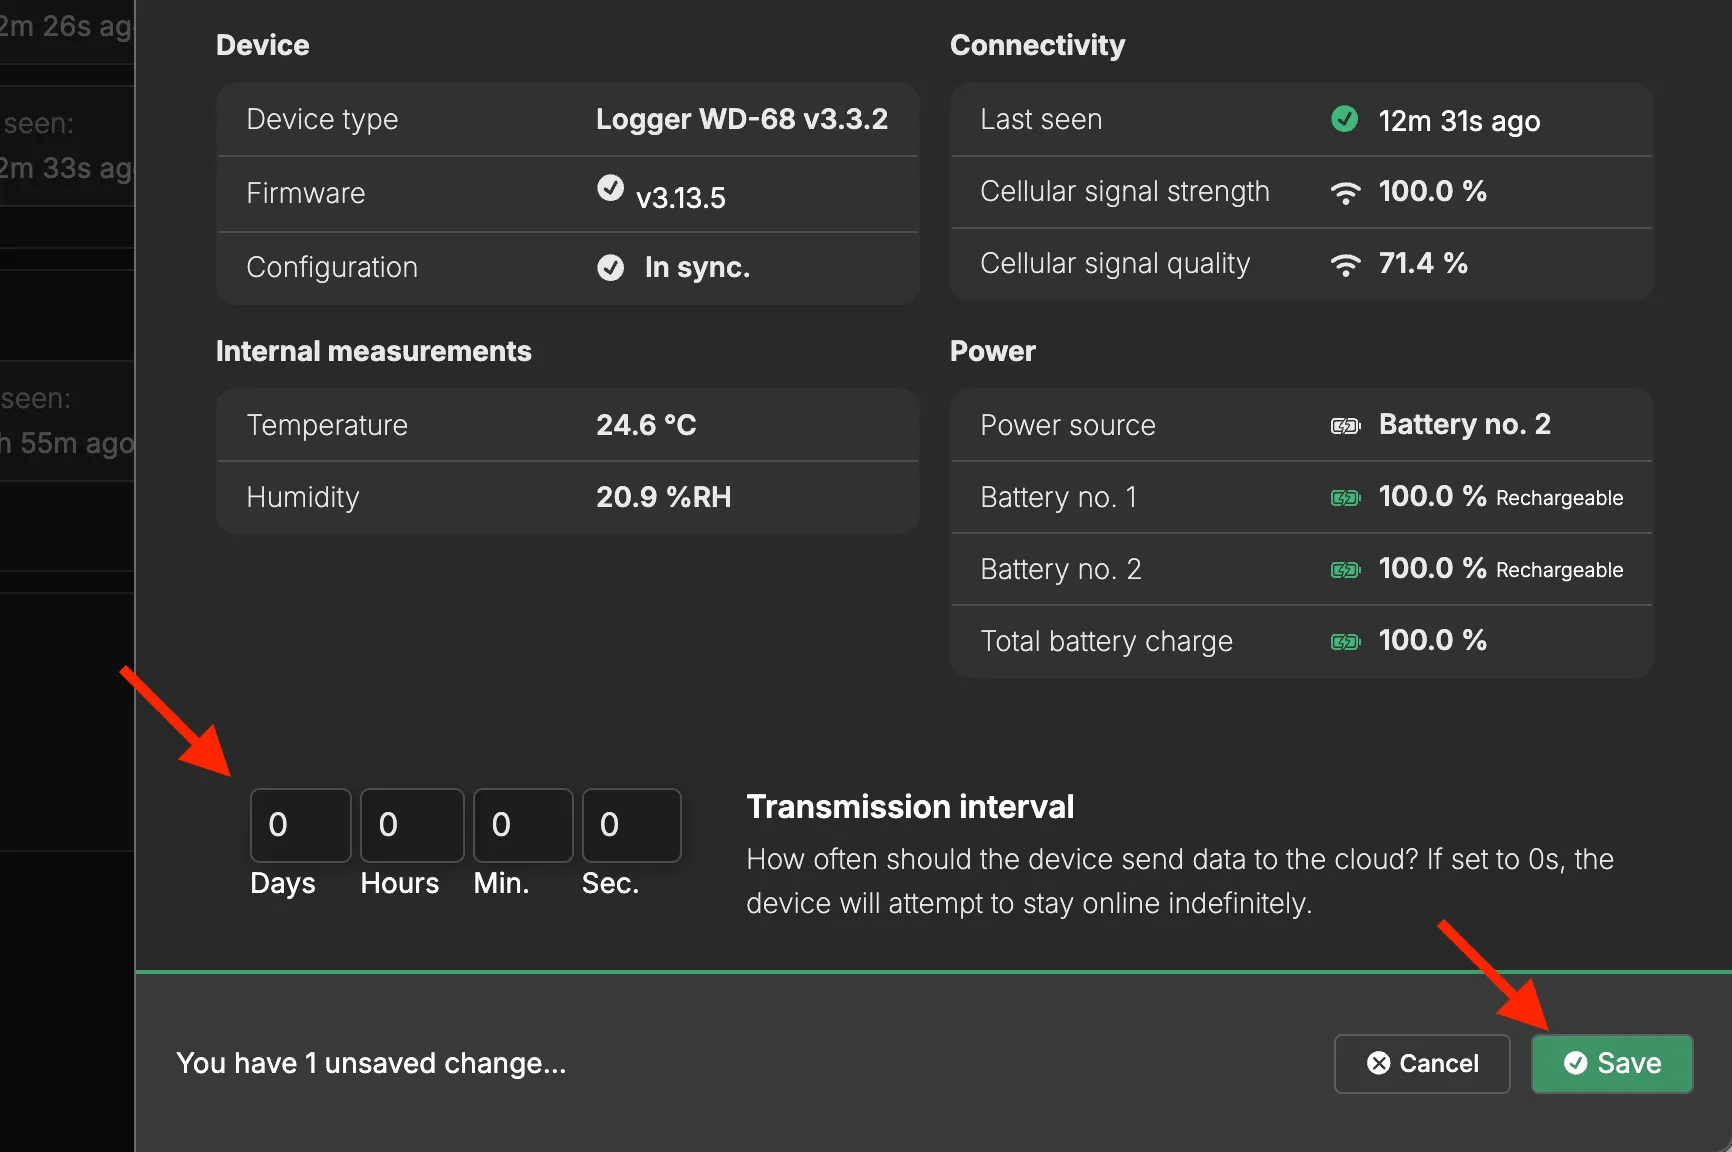 2. Press **Restart** shortly on the Logger to force a restart and an immediate connection, so the new setting is synchronized to the device right away. 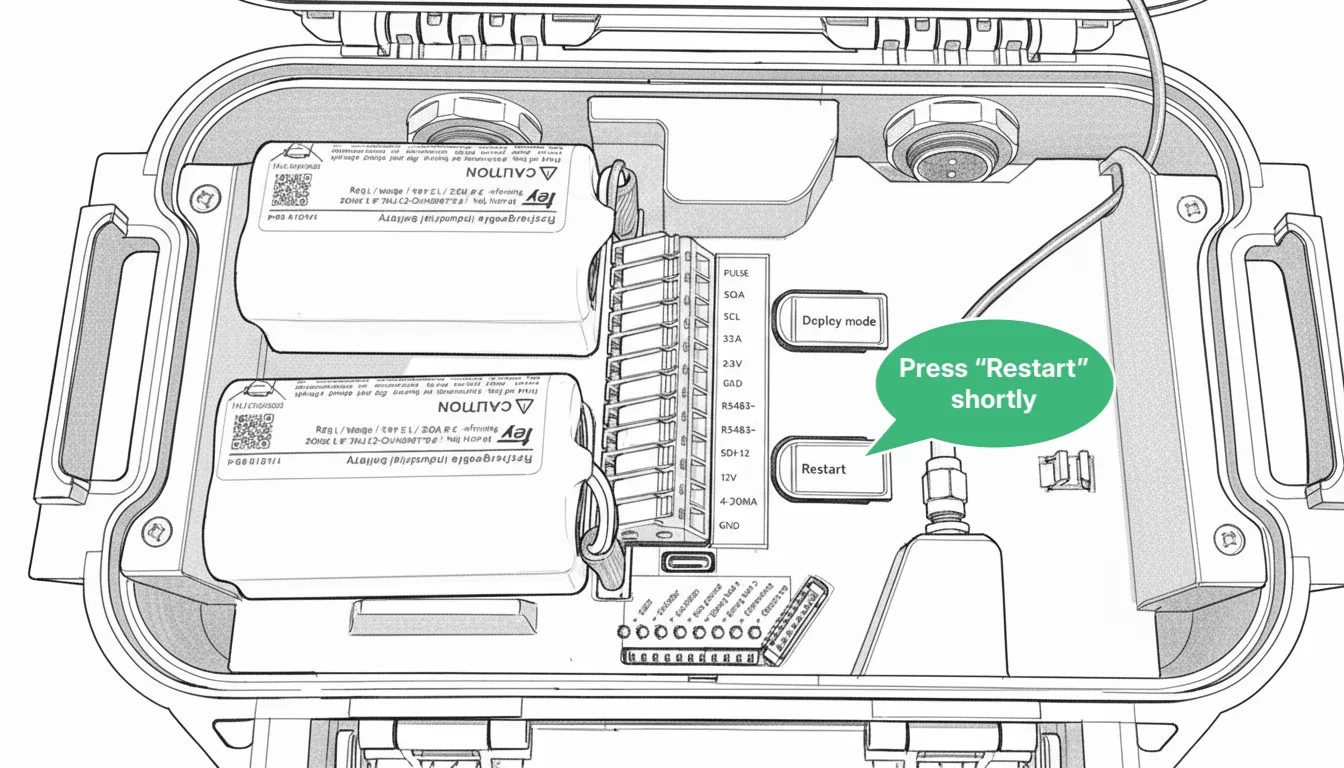 3. Wait until **Configuration** is listed as **In sync.** in Consibio Cloud. This can take a couple of minutes. 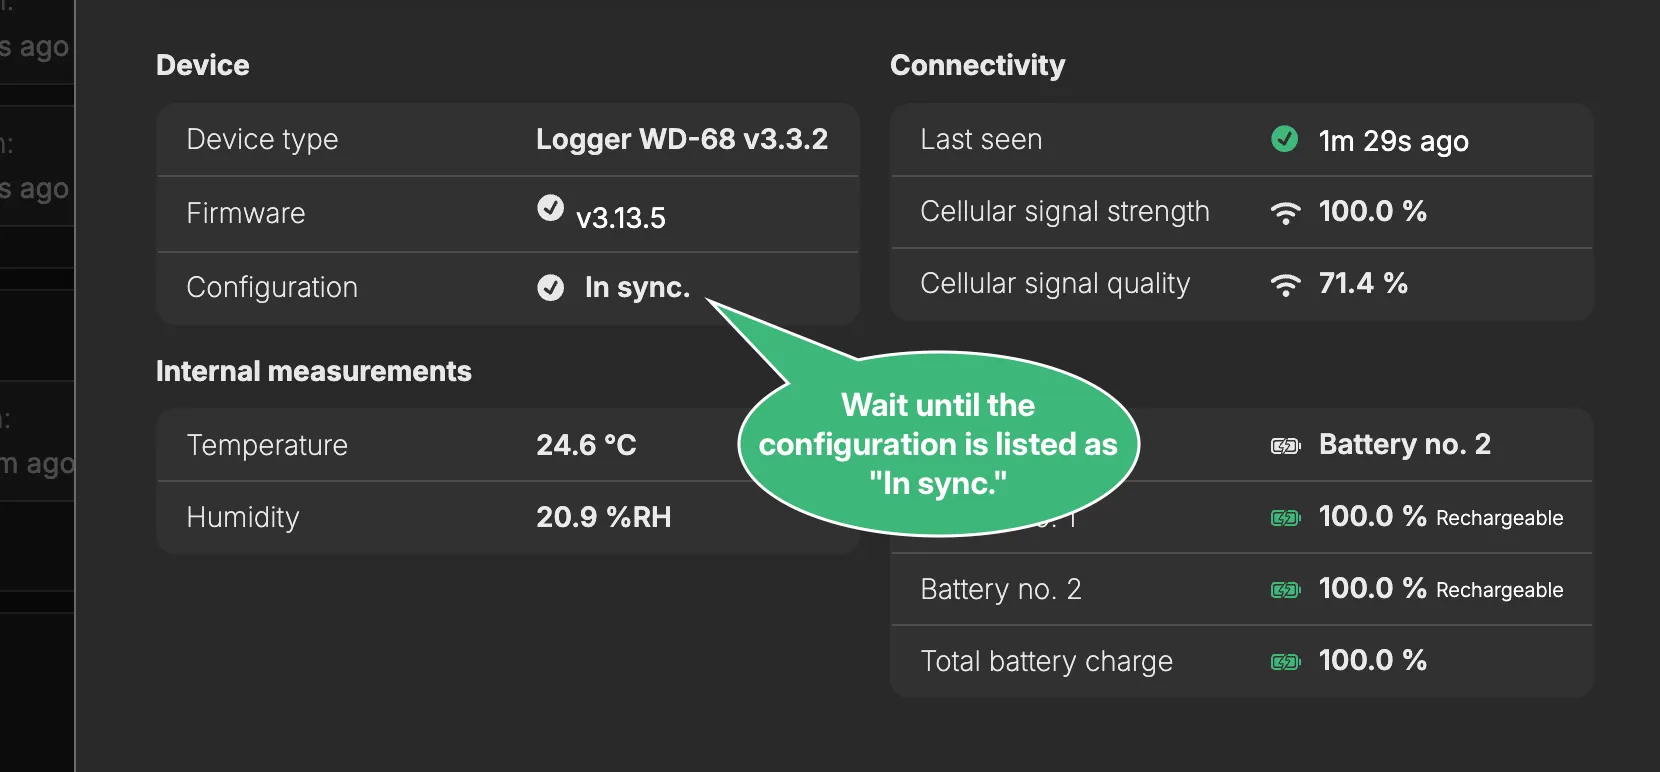 4. Wait at least **10 minutes** for the sensor to stabilize. For more about the interval settings, see [Logger WD-68](/cloud/devices/logger-wd-68/). ## 2. Calibrate at pH 7 [Section titled “2. Calibrate at pH 7”](#2-calibrate-at-ph-7) 1. Clean the sensor carefully in deionized water, then dry the electrode with a soft cloth. 2. Turn the calibration ring to the **7** indicator position and submerge the probe in the pH 7 buffer solution. 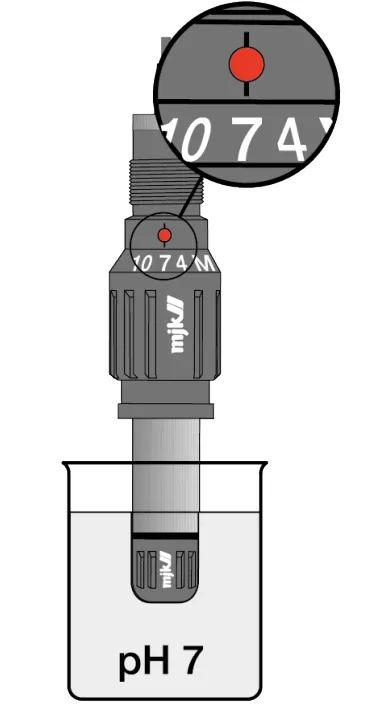 3. The sensor begins to blink **3 times** every 5 seconds. 4. Wait until the sensor blinks **2 times** every 5 seconds. The first calibration value is now saved. ## 3. Calibrate at pH 4 [Section titled “3. Calibrate at pH 4”](#3-calibrate-at-ph-4) 1. Take the sensor out of the buffer solution and dry the electrode with a soft cloth. 2. Turn the calibration ring from the **7** to the **4** indicator position and submerge the probe in the pH 4 buffer solution. 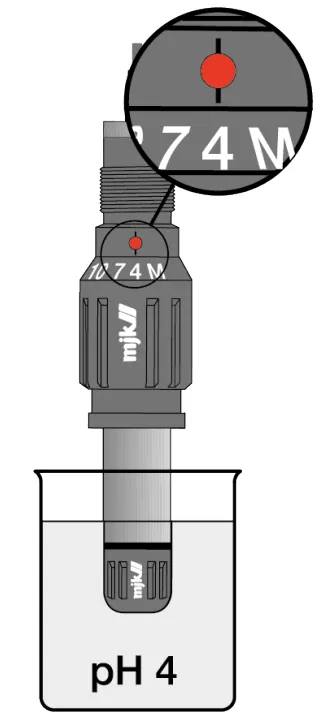 3. The sensor begins to blink **3 times** every 5 seconds. 4. Wait until the sensor blinks **2 times** every 5 seconds. The second calibration value is now saved. ## 4. Return the probe to measuring [Section titled “4. Return the probe to measuring”](#4-return-the-probe-to-measuring) Turn the calibration ring to the **M** (Measure) indicator position. 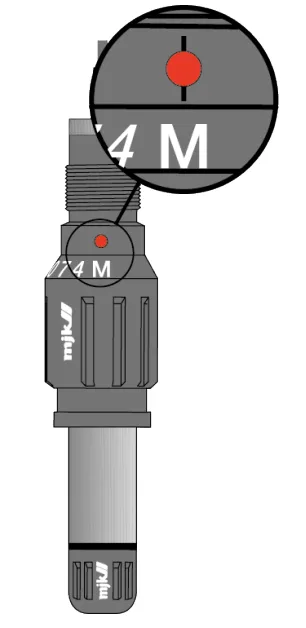 The sensor is now calibrated. ## 5. Restore the transmission interval [Section titled “5. Restore the transmission interval”](#5-restore-the-transmission-interval) Set the **Transmission interval** back to the value you want the Logger to run with, and select **Save**.  If you have any questions, reach out to us at .
# Calibrating velocity measurements
> Calibrate the surface-velocity reading of a Consibio Advanced Flow installation against a handheld reference meter in Consibio Cloud.
Consibio provides several solutions for measuring water level and flow. You get the most precise flow readings when you combine a level measurement with a direct measurement of the flow velocity — a full non-contact area-velocity flow meter setup with Consibio’s [Advanced Flow](/cloud/devices/installing-the-advanced-flow-solution/) solution. The solution relies on two radars: * **A level radar** that measures the distance from the installation point to the water surface. * **A surface velocity radar** that measures the flow velocity of the water surface. The setup is usually deploy-and-forget, but at some locations the *surface velocity* is measurably different from the *average velocity* in the channel because of the local geometry and flow conditions. In those cases you can calibrate the **velocity** reading to get the highest possible flow accuracy. For the details of the calibration tool used in the last step, see [Calibrating a sensor](/cloud/devices/calibrating-a-sensor/). ## 1. Go to the site [Section titled “1. Go to the site”](#1-go-to-the-site) Go to the site of the flow installation and bring a smartphone, tablet or laptop so you can access Consibio Cloud on the go. ## 2. Perform a reference measurement [Section titled “2. Perform a reference measurement”](#2-perform-a-reference-measurement) Measure the current velocity in the water stream with a handheld velocity meter. Any submersible water velocity meter can be used, but remember that the accuracy of the handheld instrument directly affects the accuracy of the calibration. An example of an appropriate instrument is the [Flow Probe from YSI](https://www.ysi.com/flow-probe). If possible, take the average of multiple readings at different depths and places in the stream to account for non-planar velocity profiles. Some handheld instruments can do this averaging for you automatically. Note down this reading — you need it shortly. ## 3. Make the Logger send the latest value to Consibio Cloud [Section titled “3. Make the Logger send the latest value to Consibio Cloud”](#3-make-the-logger-send-the-latest-value-to-consibio-cloud) Now make the Logger take a measurement and send it immediately, so your reference measurement and the sensor measurement are captured at nearly the same time. To do that, activate **Deploy Mode** on the Logger: 1. Press **Restart** shortly. 2. Hold **Deploy Mode** for approximately 5s. When the LEDs flash quickly one at a time in a repeating pattern, Deploy Mode is activated. 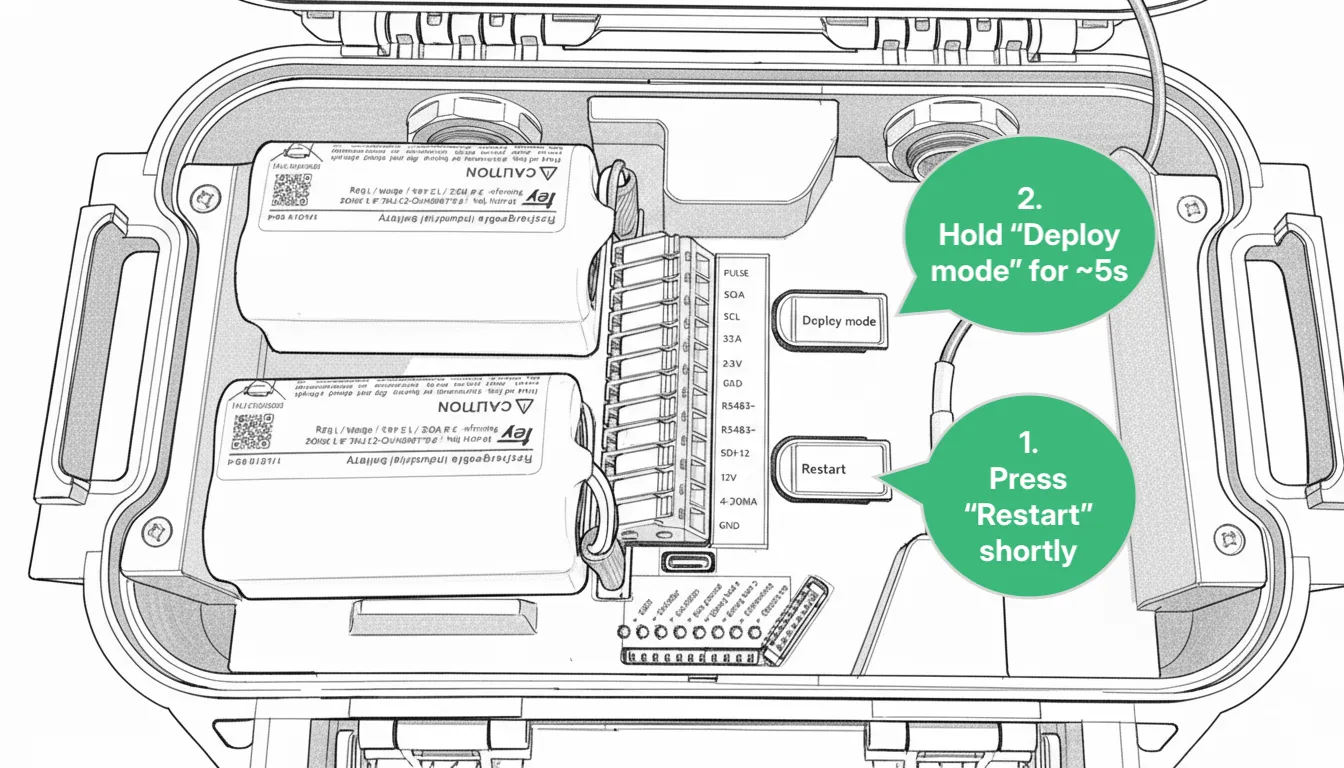 For the next **1 hour**, the device makes a **measurement every 30s** and **transmits every 5 mins**. After 1 hour, it reverts to the transmission and measurement interval configured in Consibio Cloud. If the Logger has not connected on this physical site before, opening the connection can take some minutes on the first attempt. ## 4. Enter the calibration in Consibio Cloud [Section titled “4. Enter the calibration in Consibio Cloud”](#4-enter-the-calibration-in-consibio-cloud) Open Consibio Cloud at [v3.consibio.cloud](https://v3.consibio.cloud) and open the project you use for this setup. (You can also [install Consibio Cloud as an app](/cloud/install-consibio-cloud-as-an-app/).) Go to the **Elements** tab and find the velocity element for this location. If the project has many elements, use the search filters at the top and search for “Velocity” or similar. Select the element, scroll to the bottom and select **Calibrate**: 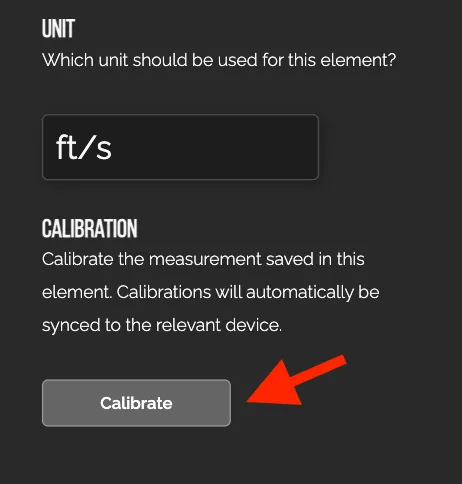 Select **Enter calibration points**: 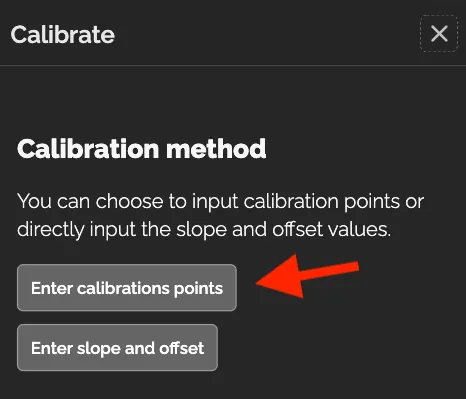 Under **Measured value**, the most recent value shows up automatically: 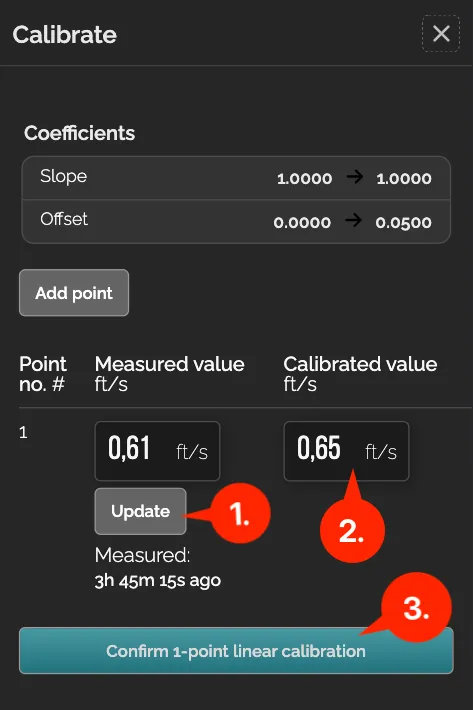 1. If you just forced the Logger to transmit (step 3), it can take a couple of minutes to connect, depending on local coverage. Until then the latest value might be several hours old. Wait a minute and select **Update** to pull the latest value. 2. Under **Calibrated value**, enter the averaged velocity you measured in step 2. 3. Select **Confirm 1-point linear calibration**. That’s it — the calibration is saved in Consibio Cloud. The next time the Logger connects, it receives the new calibration and uses it from then on. If you have any questions, reach out to us at .
# Charging the batteries
> Charge the rechargeable batteries from a Consibio Logger with the battery charger, or in the Logger itself over USB-C.
The Consibio Logger runs on two rechargeable batteries. You can charge them with the dedicated battery charger, or leave them in the Logger and power it over USB-C. ## Required equipment [Section titled “Required equipment”](#required-equipment) * The batteries from the Consibio Logger * The Consibio battery charger ## 1. Connect [Section titled “1. Connect”](#1-connect) Connect the batteries to the charger, and connect the charger to power. 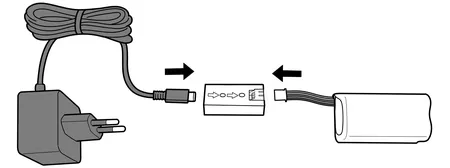 ## 2. Charge [Section titled “2. Charge”](#2-charge) The batteries now charge. While charging, the charger shows **two green LEDs**. 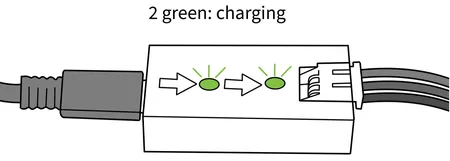 ## 3. Done [Section titled “3. Done”](#3-done) When only **one green LED** remains lit, the batteries are fully charged and ready to use. 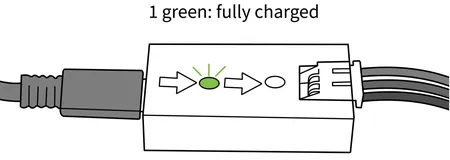 ## Charging the batteries in the Logger [Section titled “Charging the batteries in the Logger”](#charging-the-batteries-in-the-logger) You don’t have to remove the batteries to charge them. If you connect a **USB-C power supply** to the Logger while the batteries are installed, the Logger charges both batteries in place. This is convenient when the Logger is already mounted and you just need to top up the batteries. If you have any questions, reach out to us at .
# Claiming a device
> Add a Consibio device to your project by scanning its QR code or entering its device ID.
Before a Consibio device can send data to your project, it must be **claimed**. Claiming connects the physical device to your project so that its measurements, status and battery level show up in Consibio Cloud. ## What you need [Section titled “What you need”](#what-you-need) * A Consibio Cloud account with permission to add devices to the project. * The device itself — the QR code is printed on it. ## Claim the device [Section titled “Claim the device”](#claim-the-device) 1. In Consibio Cloud, open the **Devices** view from the main menu. 2. Select **Claim device**. 3. Scan the QR code on the device with your camera — or enter the device ID manually if scanning isn’t possible. 4. Confirm which project the device should be added to. 5. Give the device a recognizable name (for example, the location where it’s installed). The device now appears in your Devices list. Once it comes online, its measurements start flowing into the project automatically. ## Troubleshooting [Section titled “Troubleshooting”](#troubleshooting) * **The device doesn’t appear after claiming** — devices report on an interval; give it a few minutes. Check that the device is powered on. * **“Device already claimed”** — the device belongs to another project. It must be released from that project before it can be claimed again. Contact your administrator, or if you don’t know which project claimed it.
# Connecting a sensor to the M12 connector on Logger WD-68 and 4WD
> Wire a sensor to the M12 connector on a Logger WD-68 or 4WD datalogger.
Logger WD-68 and Logger 4WD use a standardized M12 connector that lets you connect sensors in a plug-and-play fashion. Sensors provided directly by Consibio have this connector attached by default. You can also attach the connector to third-party sensors and use the same plug-and-play functionality. The specification for the M12 connector is defined below. Disclaimer Using a custom connector is always at your own risk. Wiring the connector wrong can potentially damage the Logger. This — or any other fault induced by a custom connector or sensor — is not covered by the standard warranty on the Logger. ## M12 sensor plug specification [Section titled “M12 sensor plug specification”](#m12-sensor-plug-specification) ### Plug specification [Section titled “Plug specification”](#plug-specification) Any M12 plug with the specifications below should work with the Logger. | Parameter | Value | | --------- | ------ | | Connector | M12 | | Pins | 8 | | Coding | A | | Gender | Female | We suggest the part [643721100008 from Würth Elektronik](https://www.we-online.com/en/components/products/CIRCULAR_WR_CIRCM12_FIELD_ATTACHABLE_SOLDER?sq=643721100008#643721100008). It requires soldering, but has a high IP rating (IP68). If lower IP ratings can be tolerated, other screw-type connectors can also be used. ### Signal lines [Section titled “Signal lines”](#signal-lines) | Pin no. | Signal | | ------- | --------------------------------------------------------------- | | 1 | SDI-12 | | 2 | 4-20mA input | | 3 | RS485 A(+) | | 4 | RS485 B(-) | | 5 | GND (+ shield) | | 6 | +12 or +24V output for sensor supply (configured on the Logger) | | 7 | Pulse input (NO, Normally Open) | | 8 | +3.3V output for sensor supply | 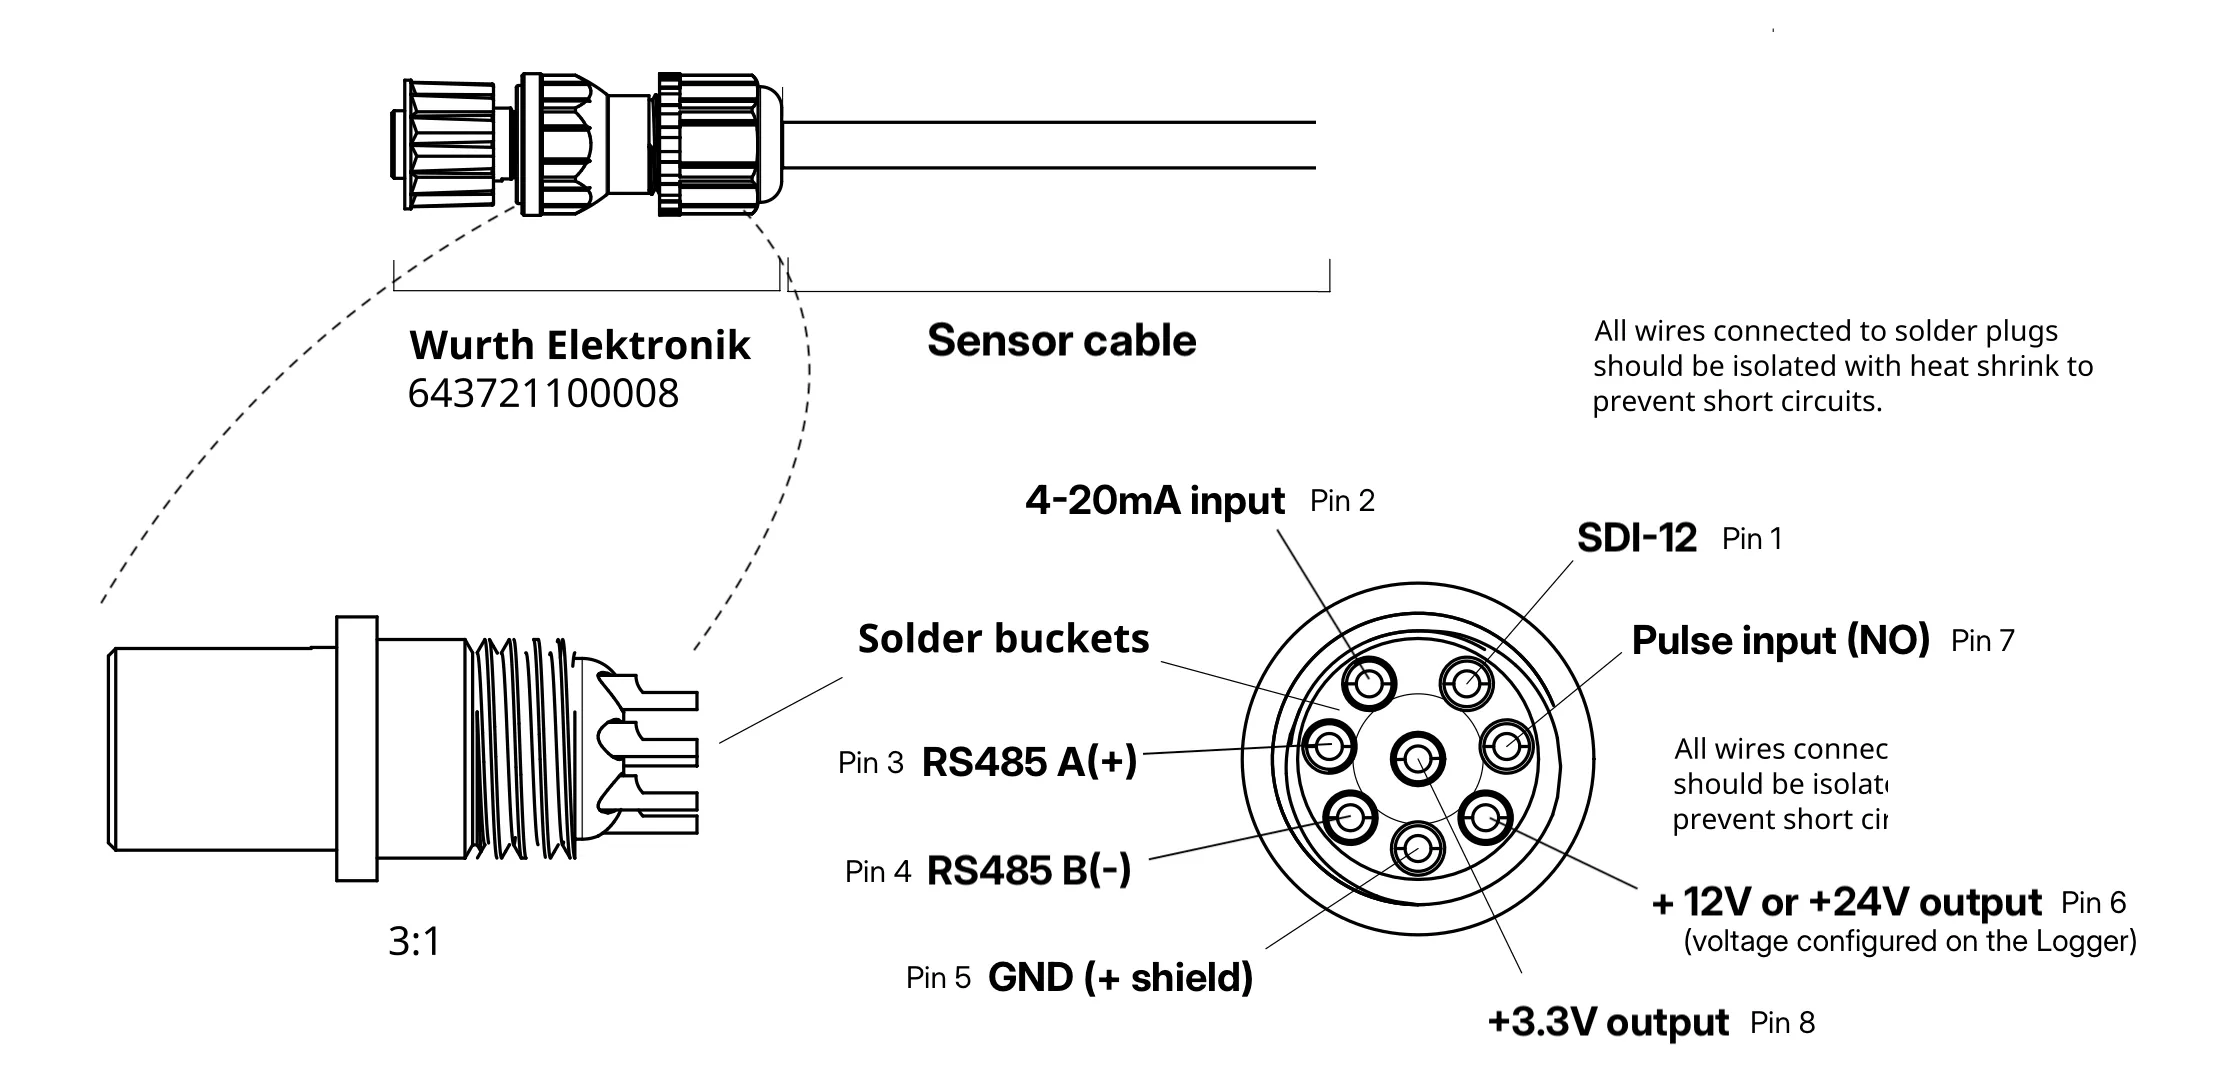 ### Mounting the 643721100008 M12 sensor plug [Section titled “Mounting the 643721100008 M12 sensor plug”](#mounting-the-643721100008-m12-sensor-plug) This guide refers to the suggested M12 sensor plug: [643721100008 from Würth Elektronik](https://www.we-online.com/en/components/products/CIRCULAR_WR_CIRCM12_FIELD_ATTACHABLE_SOLDER?sq=643721100008#643721100008). To mount the M12 sensor plug, follow the steps below: 1. Install the sensor plug onto the “Tool”, the counterpart of the sensor plug. 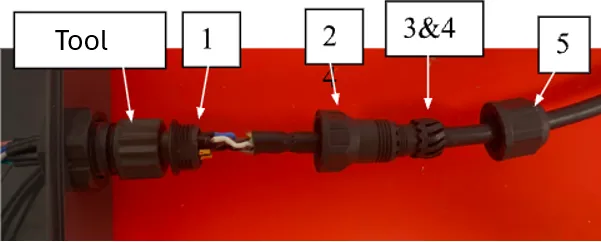 2. Screw part “2” onto part “1”. 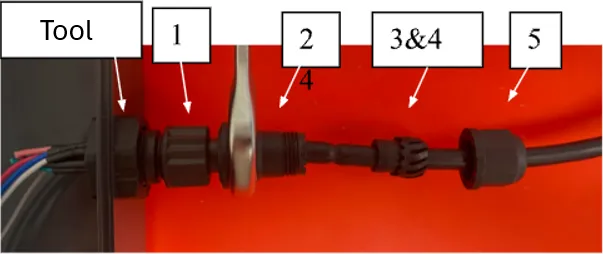 3. Unplug the sensor plug from the tool. Install the two gaskets (part 3 and part 4) onto part 2. 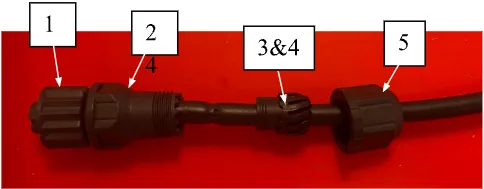 4. With the two gaskets aligned properly between part 2 and part 5, screw these together. 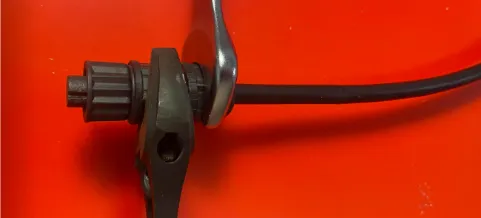 The fully assembled M12 sensor plug is shown below. 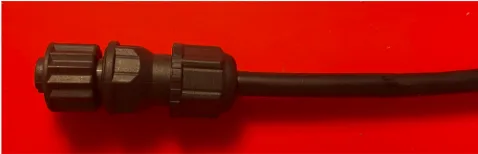 If you run into trouble wiring or mounting the connector, contact .
# Installing the Advanced Flow solution
> Install and connect a Consibio Advanced Flow measurement solution, and verify it's reporting data.
The Advanced Flow solution pairs a Logger WD-68/4WD datalogger with a level radar and a surface velocity radar to measure flow in a manhole or channel. This article covers activating the datalogger and mounting the bracket and sensors on site. ## 1. Activate Deploy Mode [Section titled “1. Activate Deploy Mode”](#1-activate-deploy-mode) The first thing to do when arriving on the installation site is to activate **Deploy Mode** on the Logger: 1. Press **Restart** shortly. 2. Hold **Deploy Mode** for approximately 5 seconds. When the LEDs flash quickly one at a time in a repeating pattern, Deploy Mode is activated.  For the next **1 hour**, the device measures every 30 seconds and transmits every 5 minutes. After 1 hour, it reverts to the transmission and measurement interval configured in Consibio Cloud. Activate Deploy Mode as the first step so the Logger starts connecting immediately — it scans the local network operators and selects the most optimal one. On the first attempt, this can take a few minutes. ## 2. Mounting instructions [Section titled “2. Mounting instructions”](#2-mounting-instructions) ### 2.1 Preferred installation: at the inlet [Section titled “2.1 Preferred installation: at the inlet”](#21-preferred-installation-at-the-inlet) The preferred installation is to mount the fixture above the **inflow**: 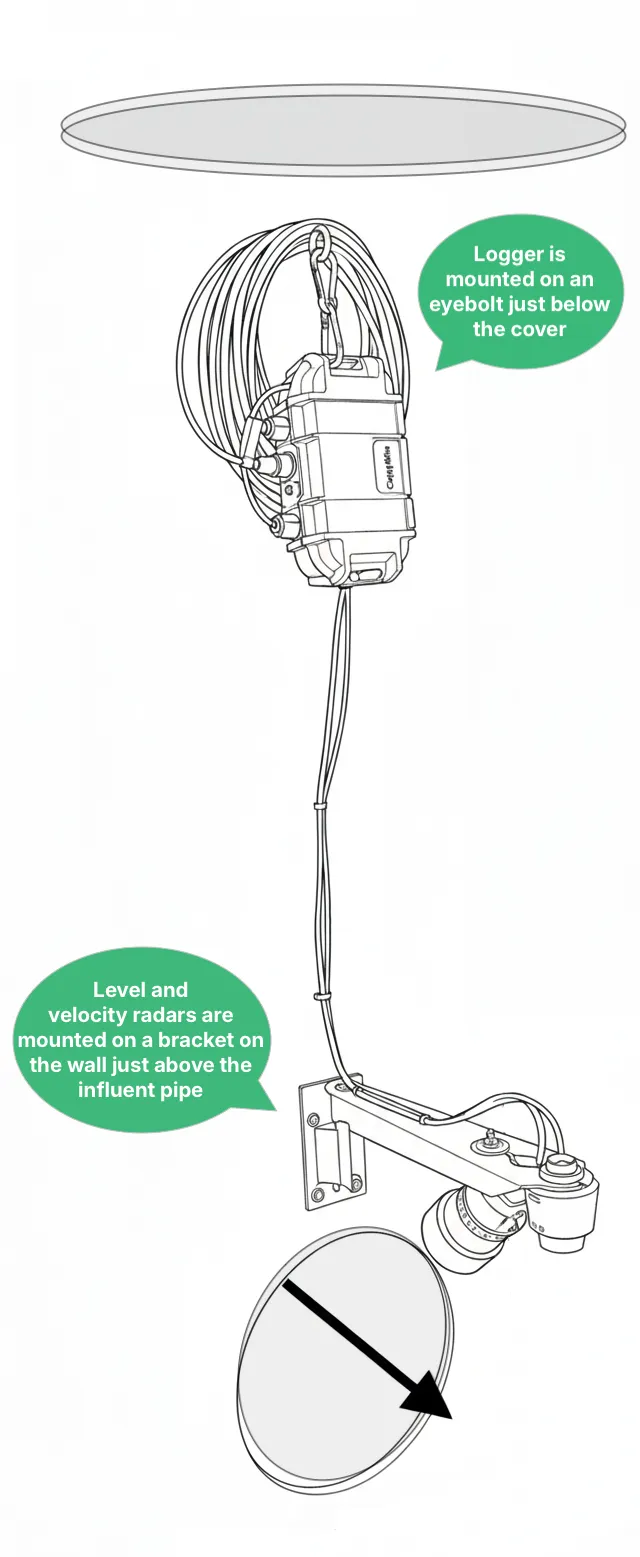 In this configuration, the surface velocity radar is mounted on the underside of the bracket to give a 45° angle. The surface velocity radar mount is attached to the bracket with the hand-operated locknut on top: 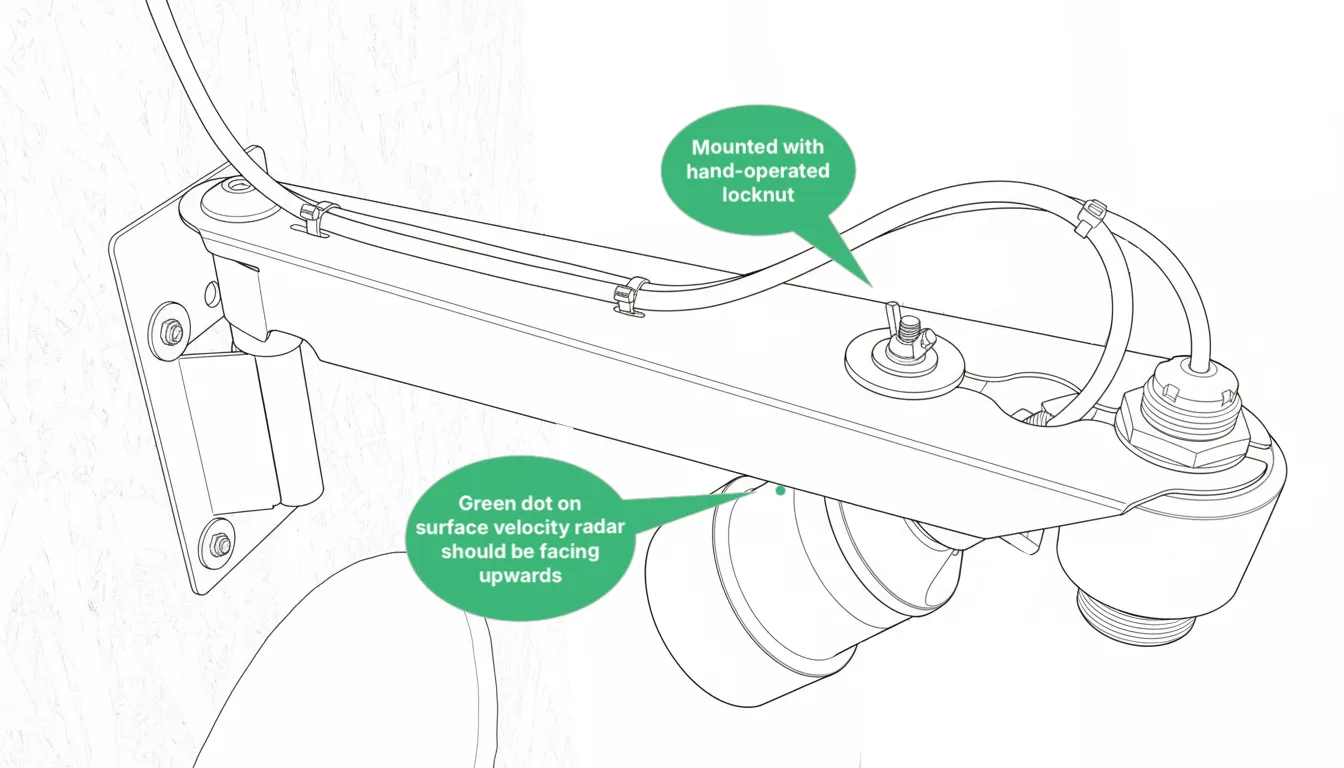 When mounting it, make sure the surface velocity radar points into the water stream: 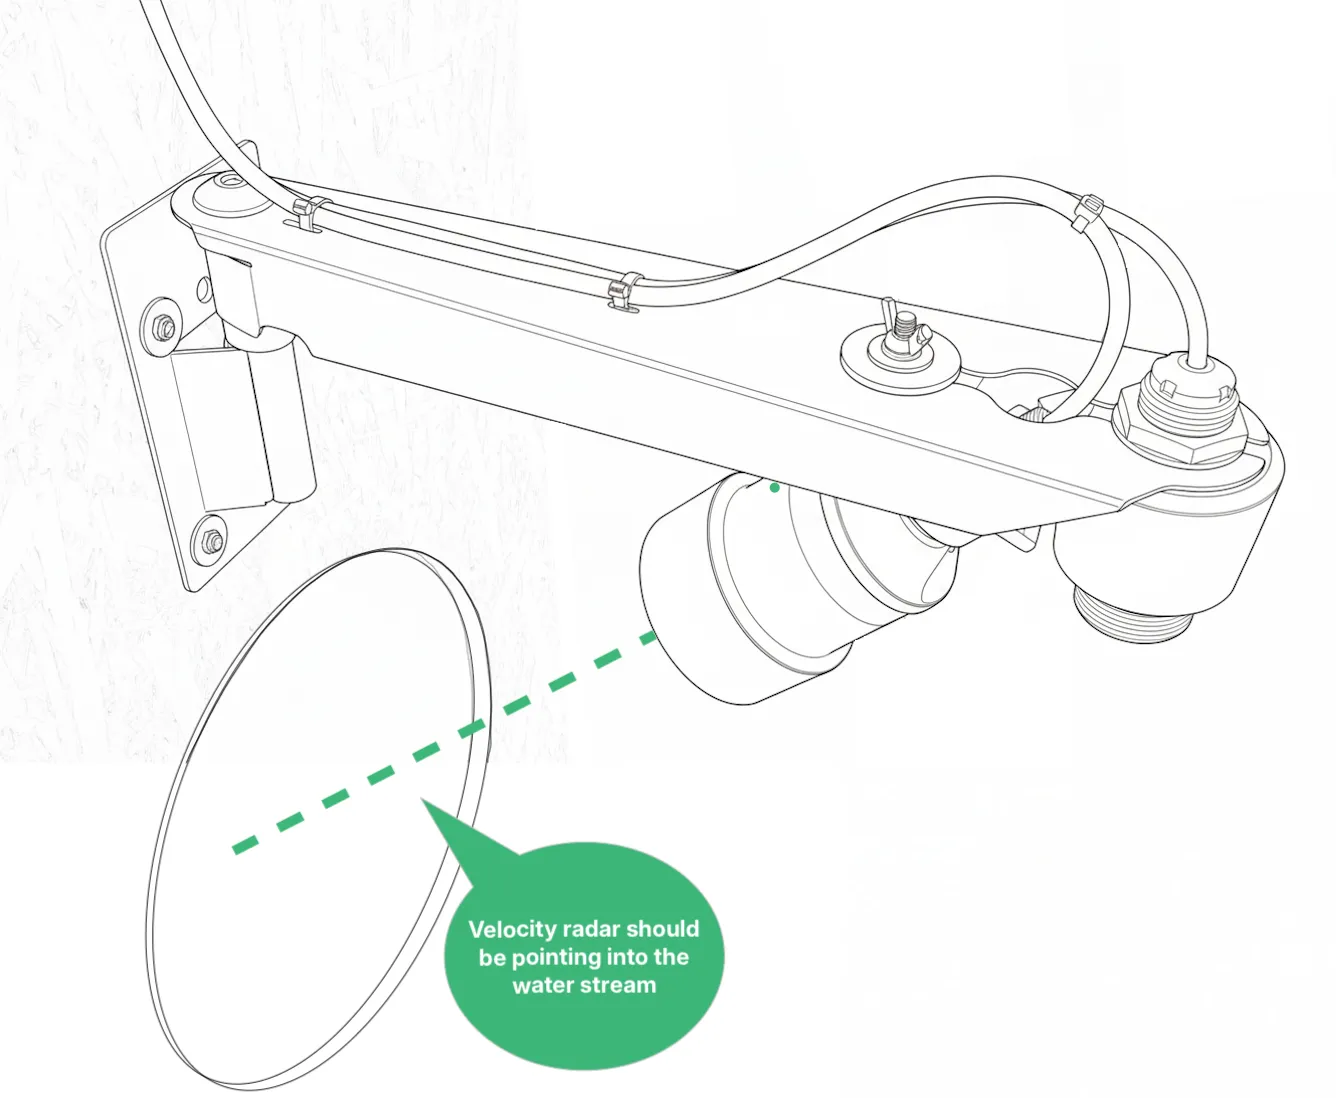 #### Installation guidelines [Section titled “Installation guidelines”](#installation-guidelines) When installing the bracket, try to respect as many of the guidelines below as possible, in priority order. On some sites the geometry of the manhole doesn’t allow all guidelines to be respected at once, so focus on the highest-priority ones first. 1. The bracket should be placed low enough that the velocity radar’s line of sight points into the water stream, not the wall. 2. The bracket should be completely level, so the level radar’s line of sight is perpendicular to the water surface. 3. The bottom of the level radar should be **at least 3 ft** above the highest expected water surface, to provide a stable reading. 4. The bottom of the bracket should be as close as possible to the perimeter of the pipe hole, to give the velocity radar the best field of view (while still respecting the other guidelines). If possible, place the bottom of the bracket panel on the wall approximately 5 cm (2 inches) above the top of the inlet pipe hole: 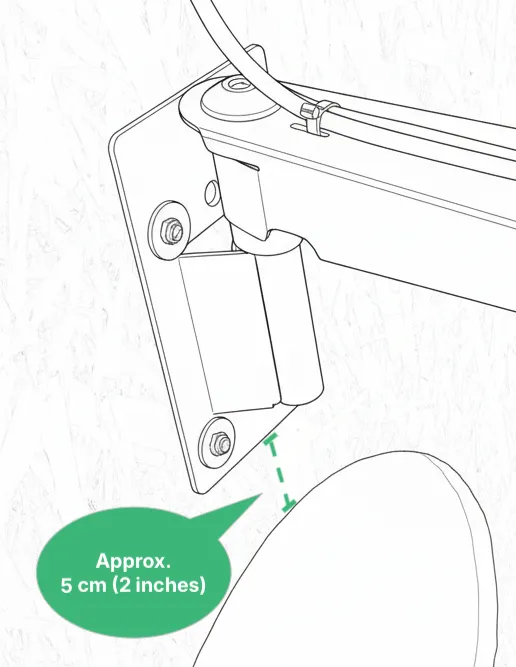 It’s possible to flip the orientation of the velocity radar and the bracket so it’s placed on the wall with the outlet instead (see [2.2 Alternative installation](#22-alternative-installation-at-the-outlet-pointing-towards-the-inlet) below). If more guidelines can be respected by doing so, switch to this alternative installation method. ### 2.2 Alternative installation: at the outlet, pointing towards the inlet [Section titled “2.2 Alternative installation: at the outlet, pointing towards the inlet”](#22-alternative-installation-at-the-outlet-pointing-towards-the-inlet) If the geometry of the manhole doesn’t allow you to install the bracket above the inlet as shown above, you can move the velocity radar mount to the top of the bracket instead. Here, the placement of the level radar and the velocity radar is swapped: 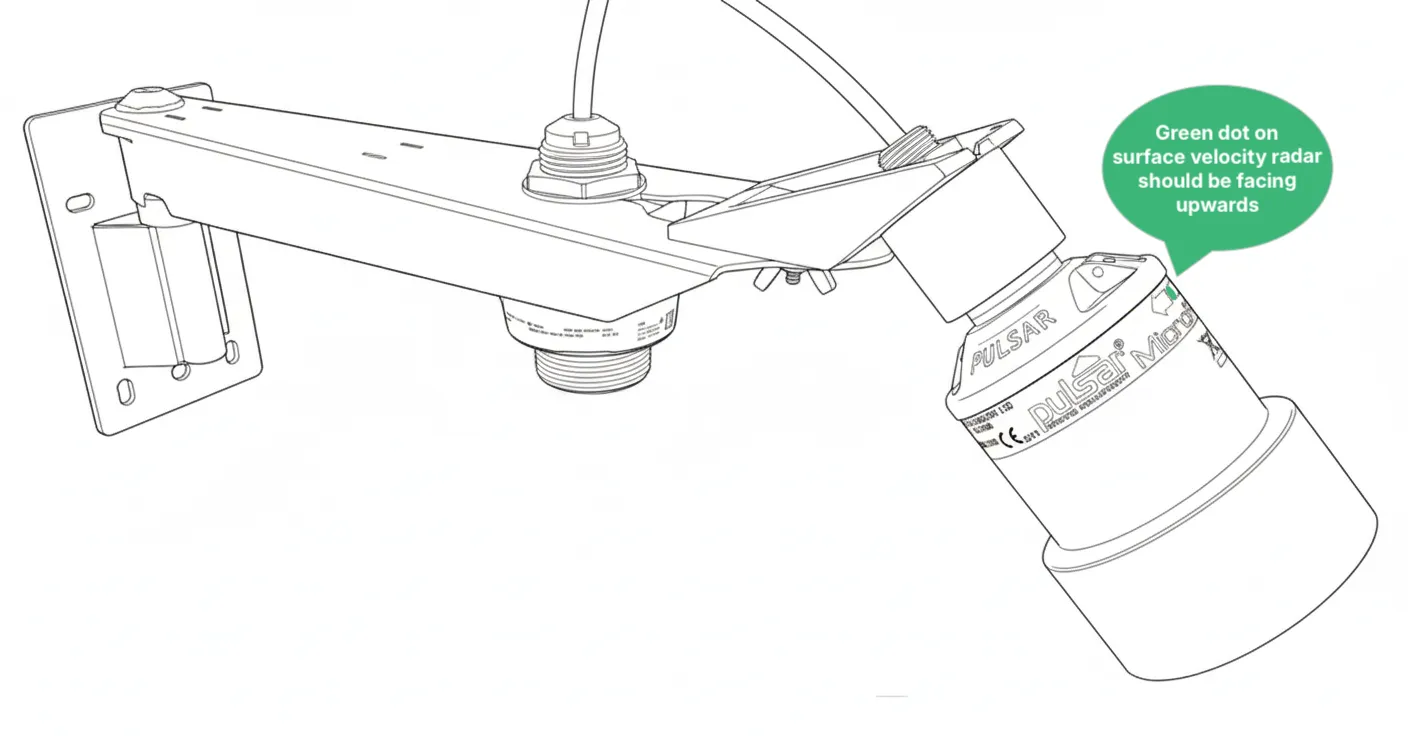 In this configuration, the bracket is installed above the outlet, pointing towards the inlet: 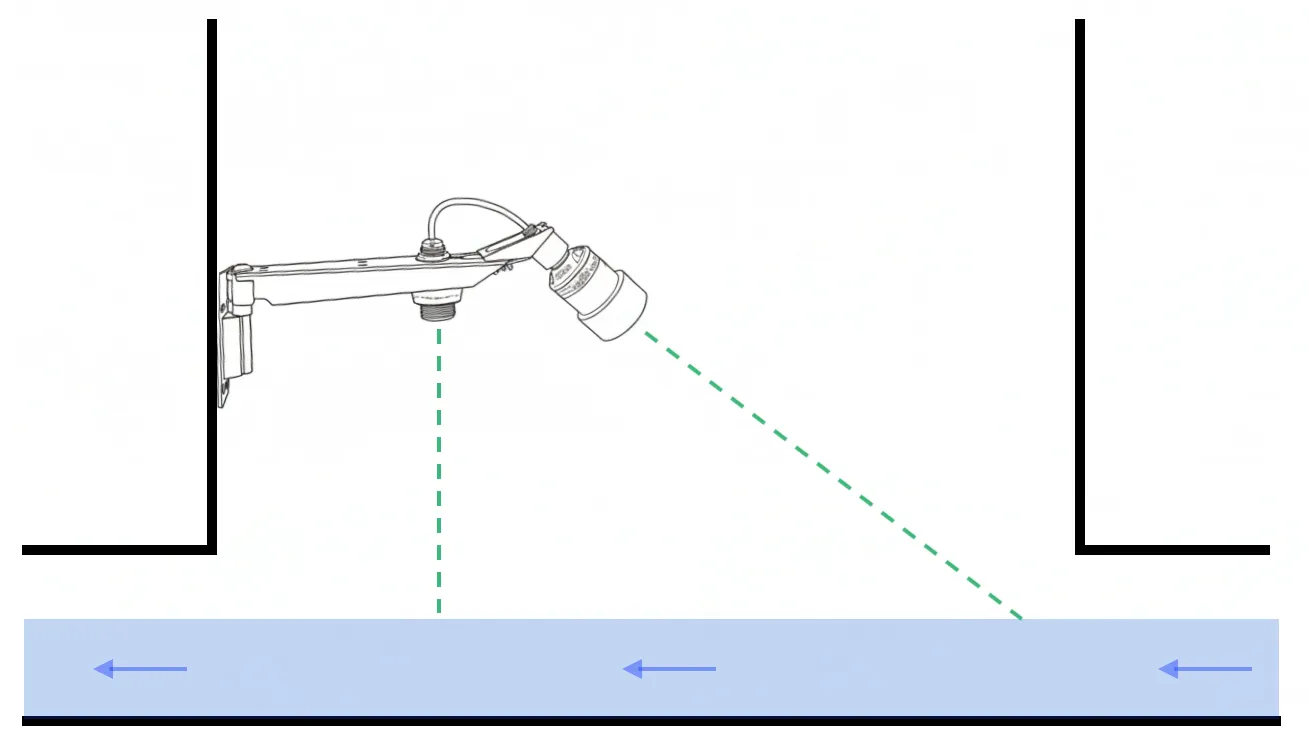 ### 2.3 Record installation dimensions [Section titled “2.3 Record installation dimensions”](#23-record-installation-dimensions) After installing the bracket with the level and velocity radar, measure the exact **installation height** — the distance from the bottom of the level sensor to the bottom of the invert in the channel (dimension **A** below). Also measure or look up the pipe diameter (dimension **D**): 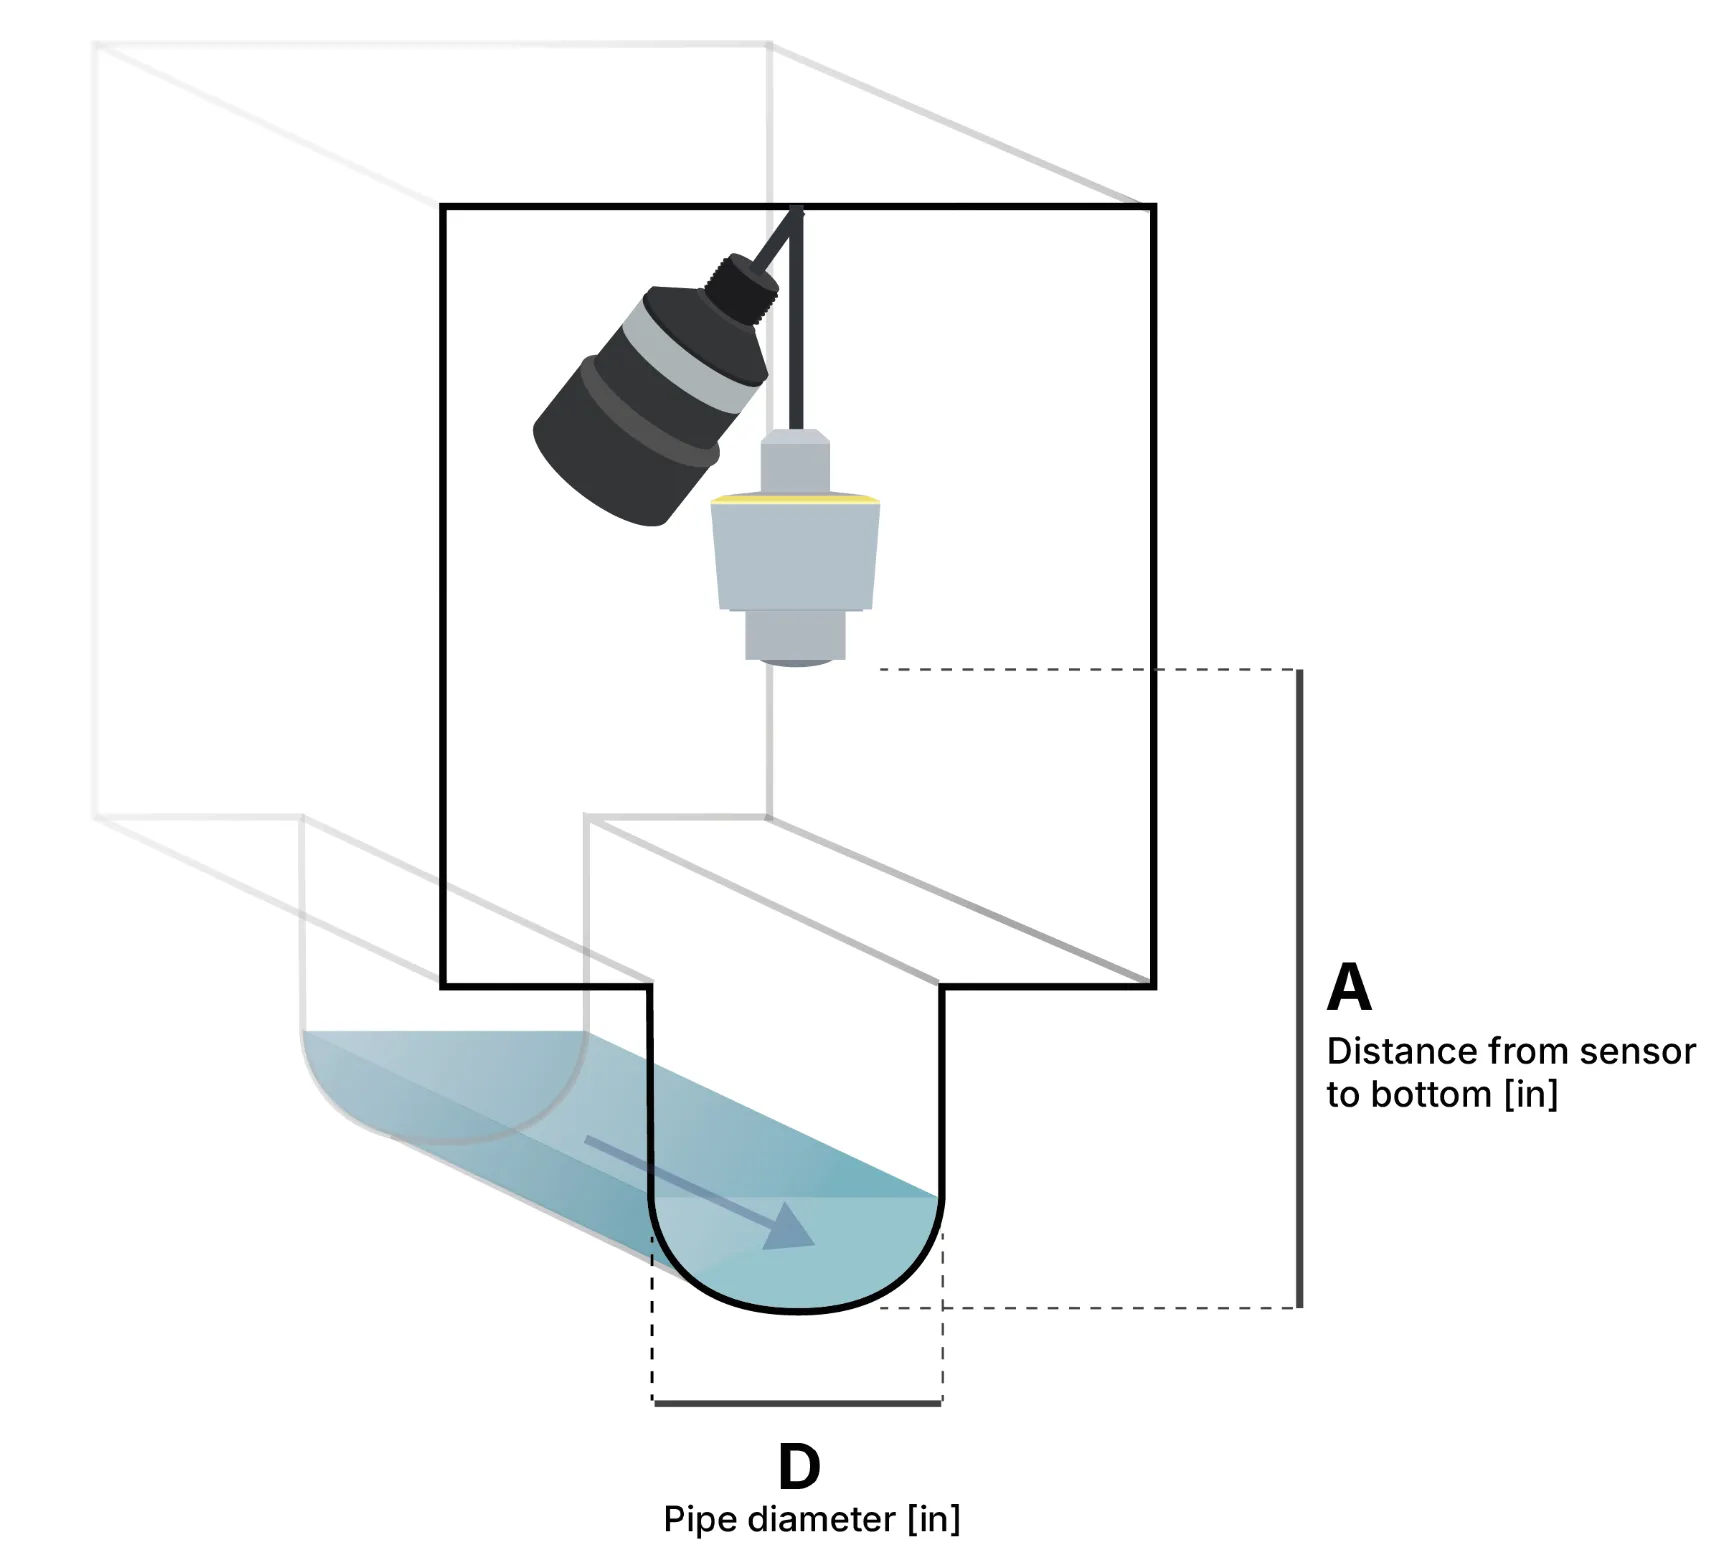
# Installing the H2S solution for Logger WD-68
> Install and connect a Consibio H2S sensor solution on a Logger WD-68, and verify it's reporting data.
The Consibio H2S solution consists of all the equipment and accessories needed to install a H2S monitoring system: * Logger WD-68 battery-driven cellular datalogger * Consibio H2S sensor v3 * Eyebolt for mounting 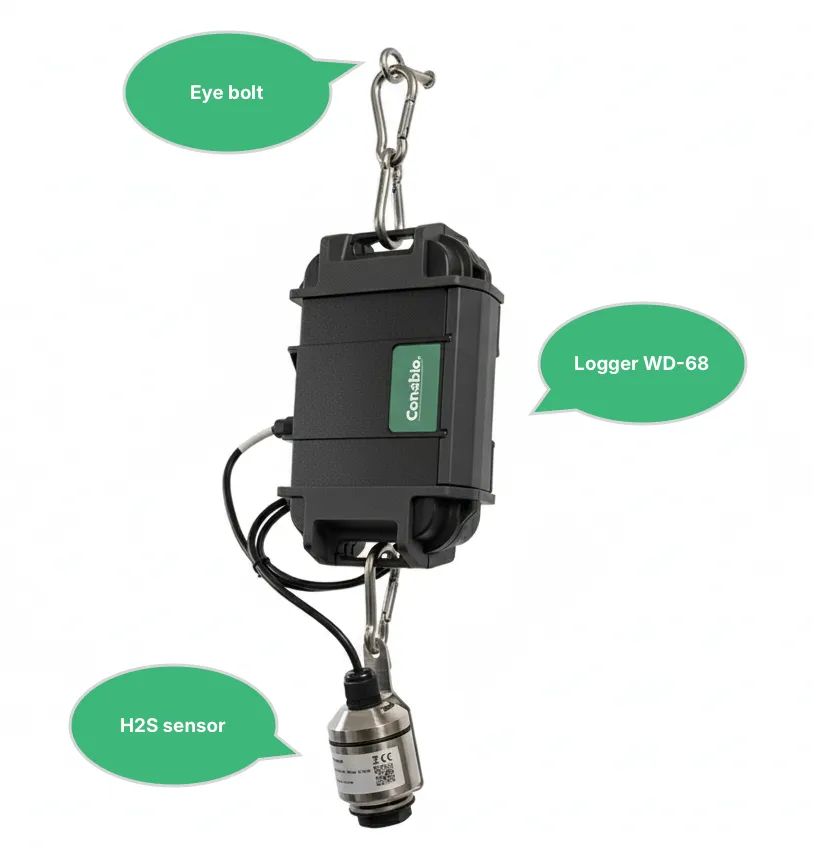 ## 1. Activate Deploy Mode [Section titled “1. Activate Deploy Mode”](#1-activate-deploy-mode) The first thing to do when arriving on the site of installation is to activate **Deploy Mode** on the Logger: 1. Press **Restart** shortly. 2. Hold **Deploy Mode** for approximately 5s. When the LEDs flash quickly one at a time in a repeating pattern, Deploy Mode is activated.  For the next **1 hour**, the device will make a **measurement every 30s** and **transmit every 5 mins**. After 1 hour, it reverts to the transmission and measurement interval configured in Consibio Cloud. Activate Deploy Mode as the first step so the Logger starts connecting immediately — it will scan the local network operators and select the most optimal one. On the first attempt, this can take some minutes. ## 2. Mounting instructions [Section titled “2. Mounting instructions”](#2-mounting-instructions) ### 2.1 Mount the Logger [Section titled “2.1 Mount the Logger”](#21-mount-the-logger) Mount the Logger just below the manhole cover using the eyebolt and carabiners. This ensures optimal cellular reception and easy access for battery swaps. 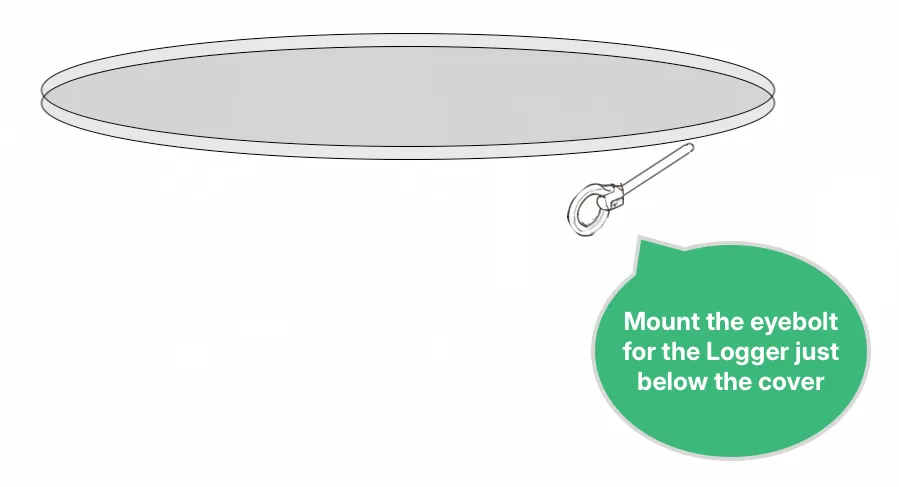 Fasten the Logger to the eyebolt using the carabiners included with the Logger: 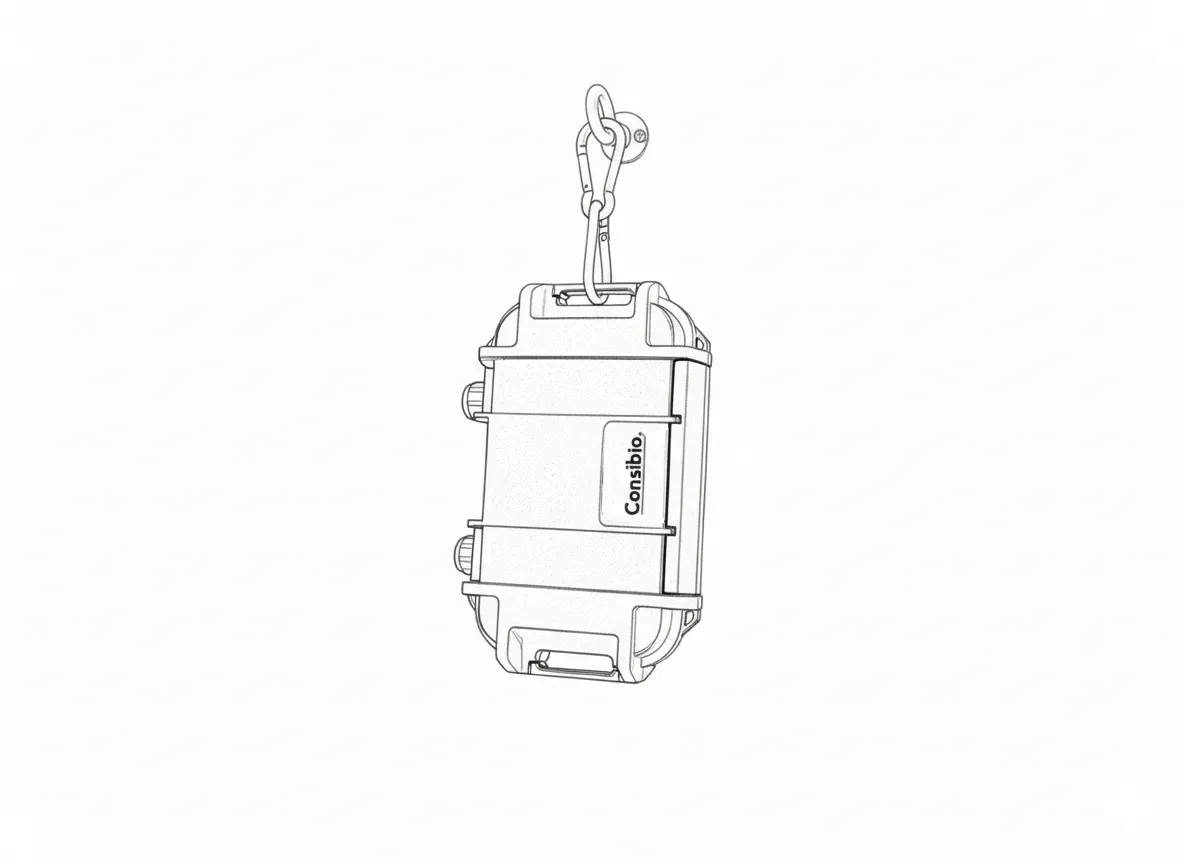 ### 2.2 Mount and connect the H2S sensor [Section titled “2.2 Mount and connect the H2S sensor”](#22-mount-and-connect-the-h2s-sensor) Mount the sensor with the pre-mounted cable hanger with carabiner on the bottom bar of the Logger WD-68: 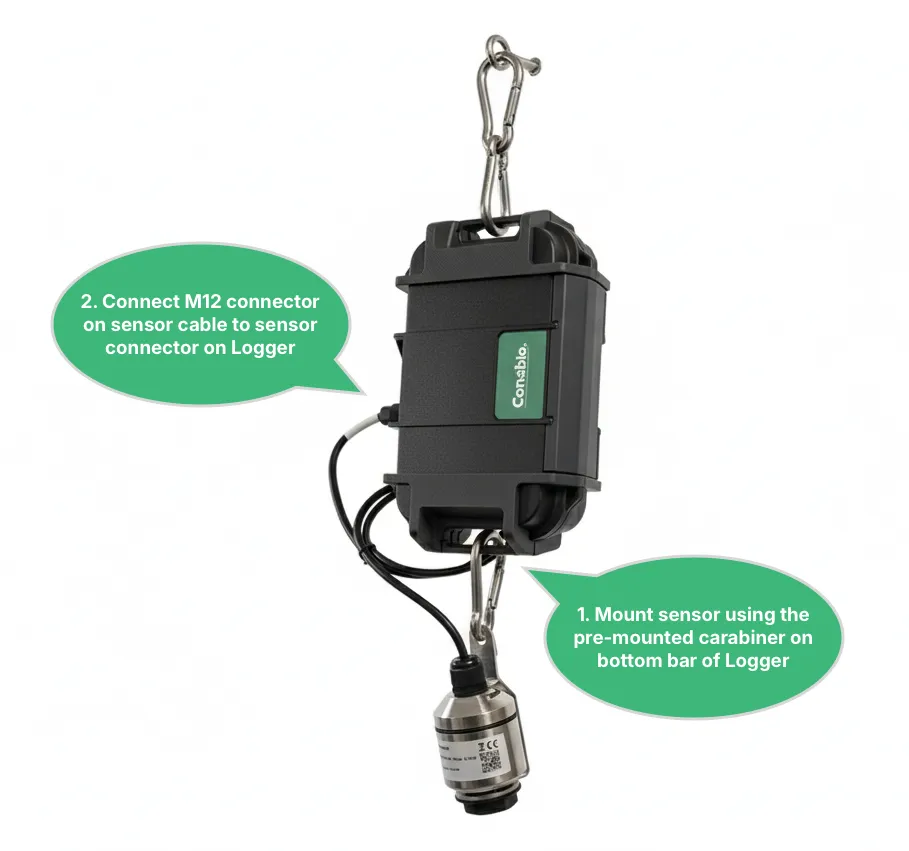 Connect the sensor to one of the Logger’s sensor connectors. You can see in Consibio Cloud, under the given device, which port the sensor is configured to. The standard is port A. 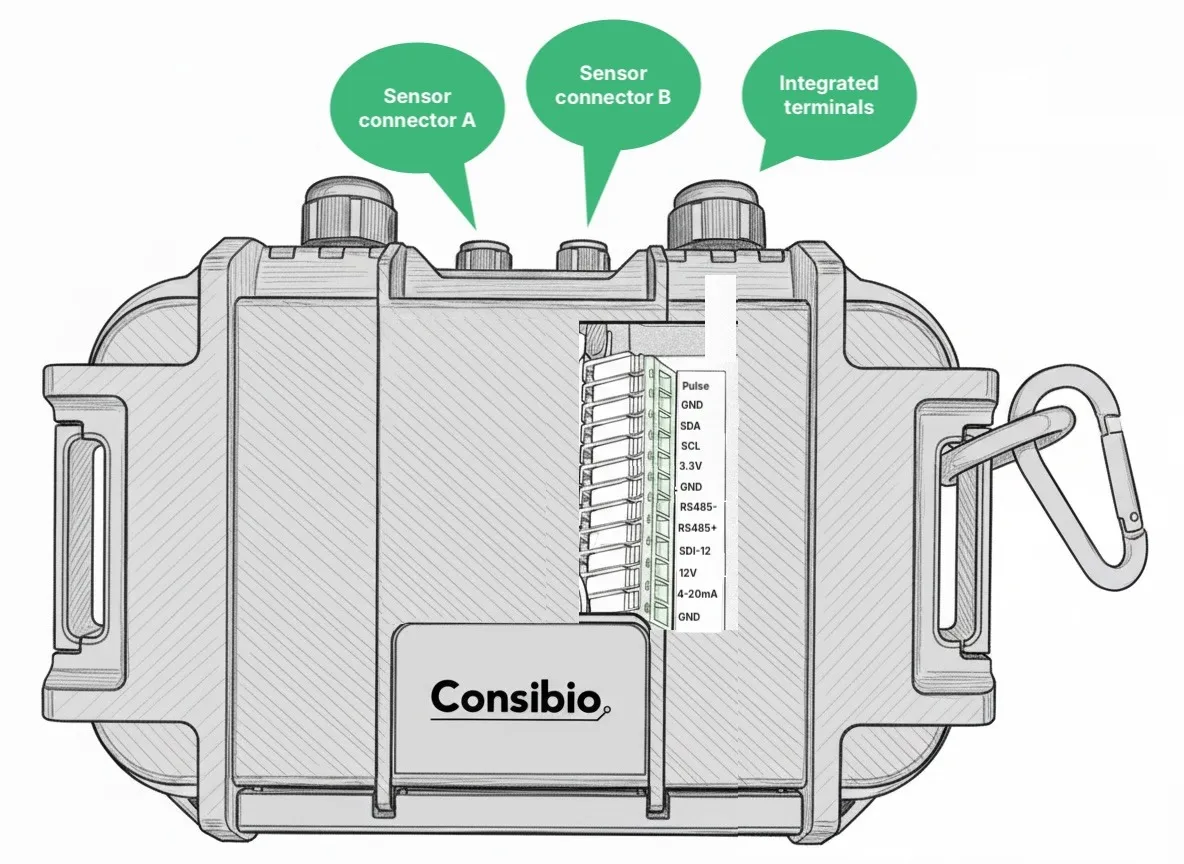 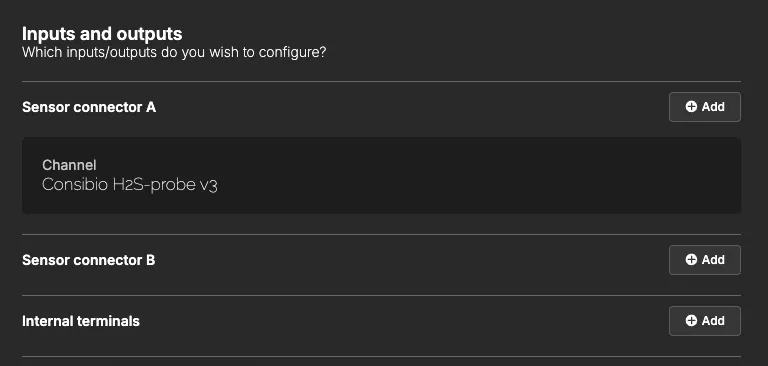 ## 3. Verify installation and data quality [Section titled “3. Verify installation and data quality”](#3-verify-installation-and-data-quality) After installation is done, put the manhole cover back on and wait 5 minutes. Deploy Mode was activated in step 1, so the Logger will attempt to connect every **5 minutes**. Before leaving the site, verify that the Logger transmits correctly through the manhole cover — it’s important to wait long enough to confirm this. Go to on a smartphone or laptop, log in to your project, and check that data is coming in from the device. If you don’t get a signal after closing the manhole cover, you can install an external antenna. ## Troubleshooting [Section titled “Troubleshooting”](#troubleshooting) * **No signal after closing the manhole cover** — install an external antenna to improve cellular reception. * **No data appears in the project after 5 minutes** — confirm Deploy Mode was activated correctly (LEDs flashing in the repeating pattern) and that the device has been [claimed](/cloud/devices/claiming-a-device/) to the project. Reach out to if you need assistance.
# Installing the Level & Flow solution for Logger WD-68
> Install and connect a Consibio Level & Flow measurement solution on a Logger WD-68, and verify it's reporting data.
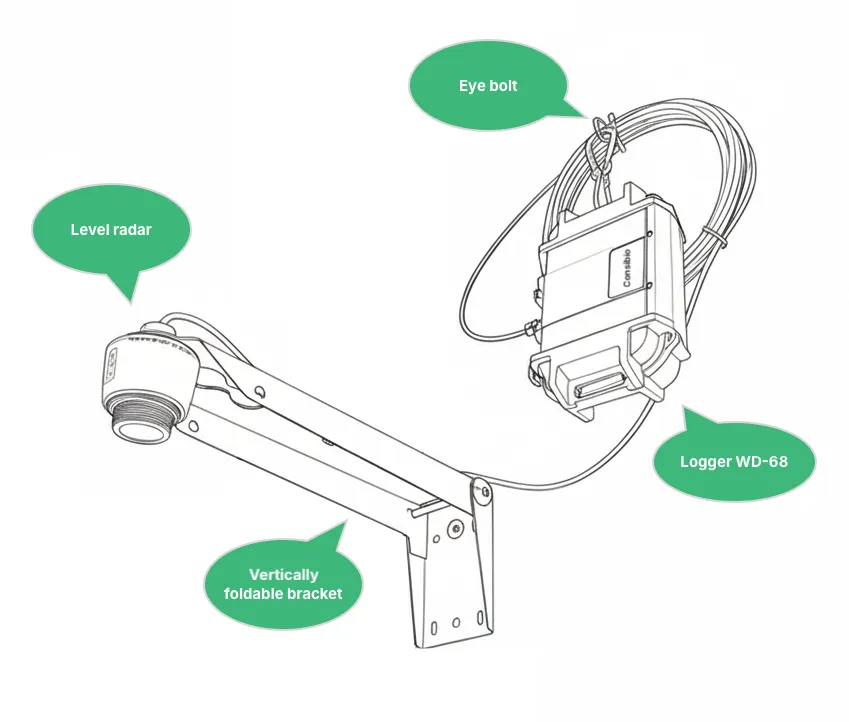 ## Equipment [Section titled “Equipment”](#equipment) The Consibio Level and Flow solution consists of all the equipment and accessories needed to install a level and flow monitoring system: * Logger WD-68 battery-driven cellular datalogger * VEGAPuls Level Radar * Vertically foldable bracket for mounting the radar * The bracket can be folded up if you need access to the manhole. * Eyebolt for mounting the Logger ## 1. Activate Deploy Mode [Section titled “1. Activate Deploy Mode”](#1-activate-deploy-mode) The first thing to do when arriving on the site of installation is to activate **Deploy Mode** on the Logger: 1. Press **Restart** shortly. 2. Hold **Deploy Mode** for approximately 5s. When the LEDs flash quickly one at a time in a repeating pattern, Deploy Mode is activated.  For the next **1 hour**, the device will make a **measurement every 30s** and **transmit every 5mins**. After 1 hour, it will revert to the transmission and measurement interval configured in Consibio Cloud. We activate this as the first step to make the Logger start connecting immediately, where it will scan the local network operators and select the most optimal one. On the first attempt, this can take some minutes. ## 2. Mounting instructions [Section titled “2. Mounting instructions”](#2-mounting-instructions) ### 2.1 Mount the radar bracket [Section titled “2.1 Mount the radar bracket”](#21-mount-the-radar-bracket) Mount the bracket on the side of the manhole with the included wall plugs and bolts. Lower the top of the bracket by the manhole’s radius (e.g., 10“ for a 20“ diameter manhole) to prevent collision with the cover when it is tilted during opening it. If it’s not practically possible to mount the radar bracket so far down, it should just be mounted as far down as possible. 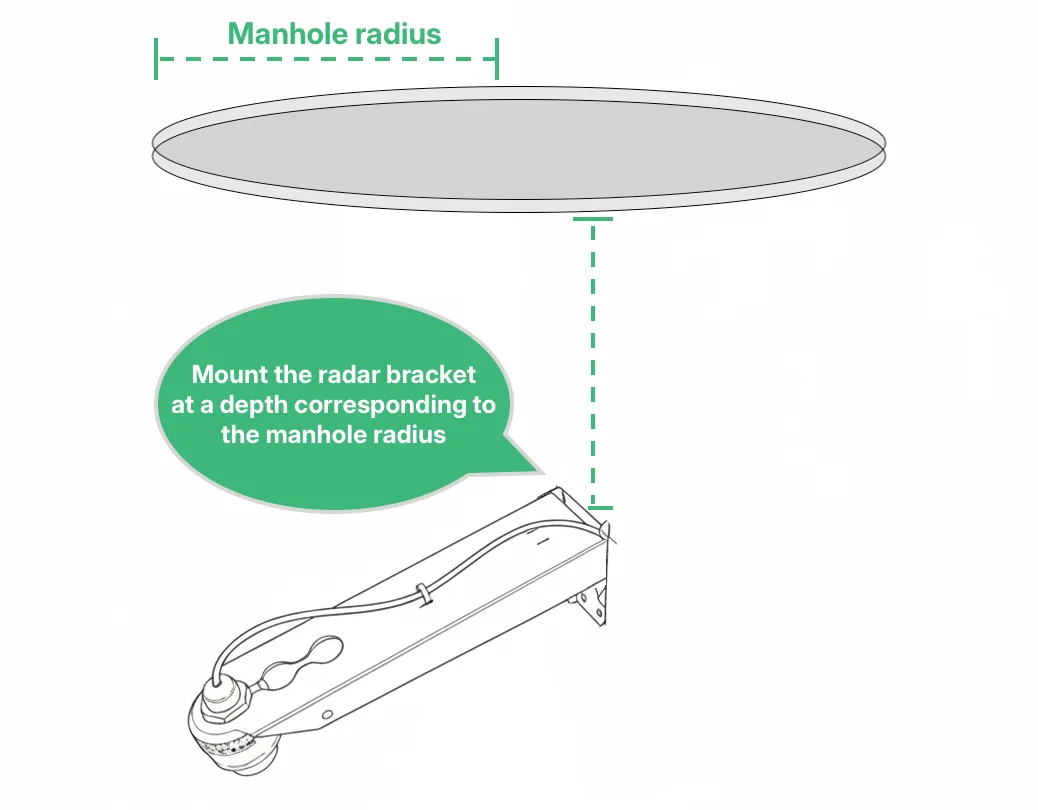 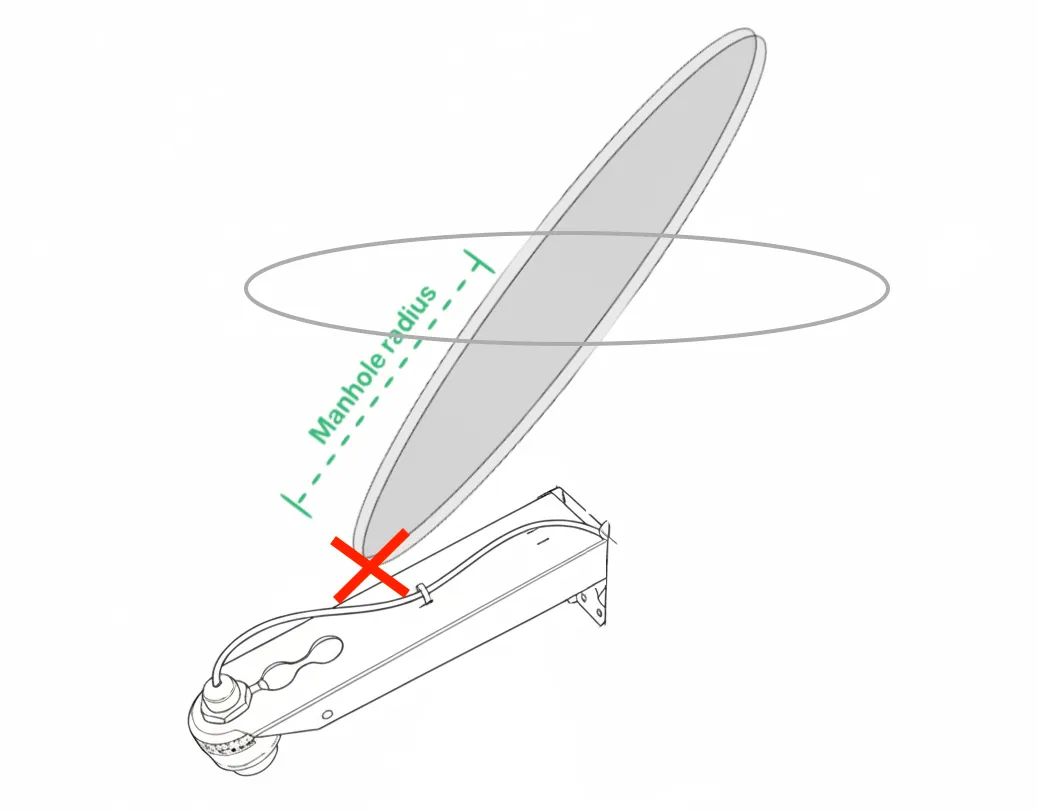 Position the bracket on a position on the wall such that the radar mounting point faces directly down into the invert. 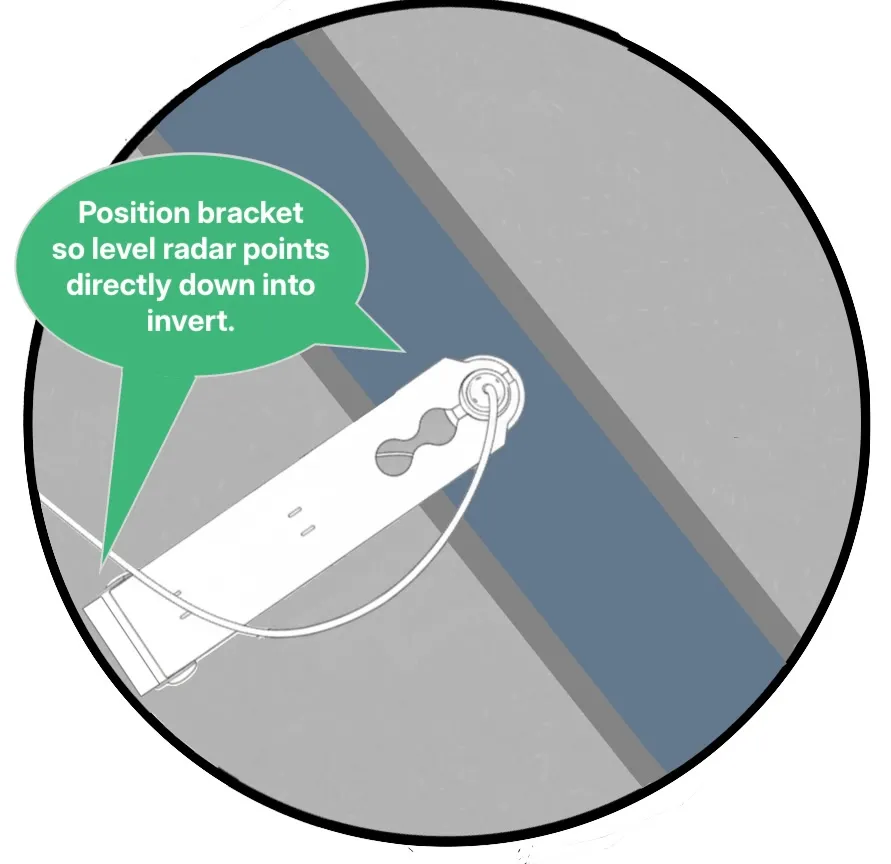 ### 2.2 Mount the Logger [Section titled “2.2 Mount the Logger”](#22-mount-the-logger) Mount the Logger just below the manhole cover using the eyebolt and carabiners. This ensures optimal cellular reception and easy access for battery swaps. 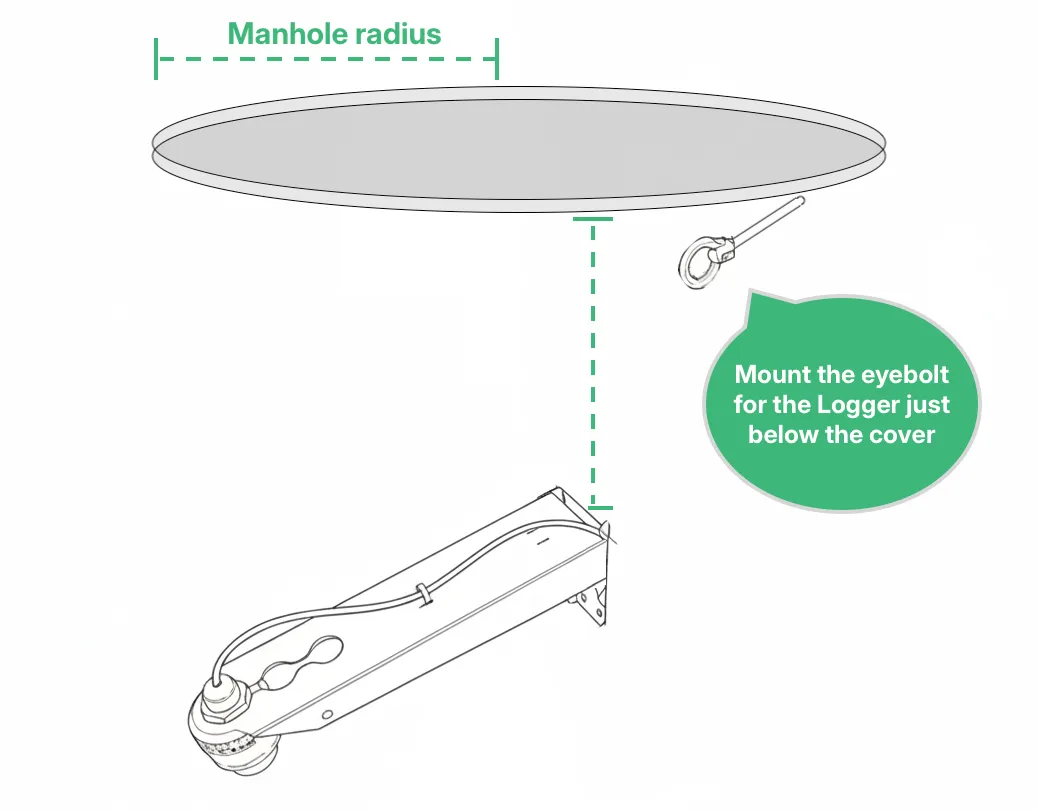 Fasten the Logger to the eyebolt using the carabiners included with the Logger.  ### 2.3 Mount and connect the level radar [Section titled “2.3 Mount and connect the level radar”](#23-mount-and-connect-the-level-radar) Mount the level radar in the bracket and secure it with the included nut. 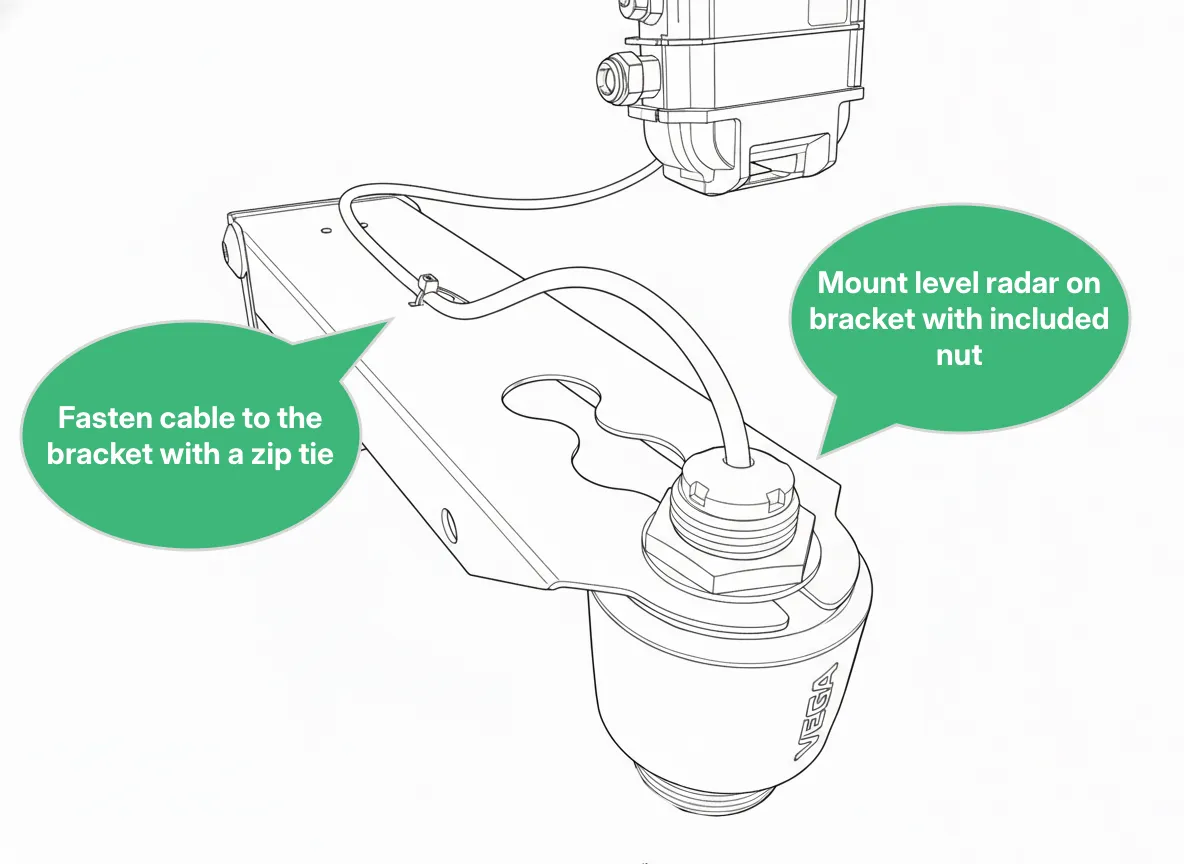 Connect the radar to one of the Logger’s sensor connectors. 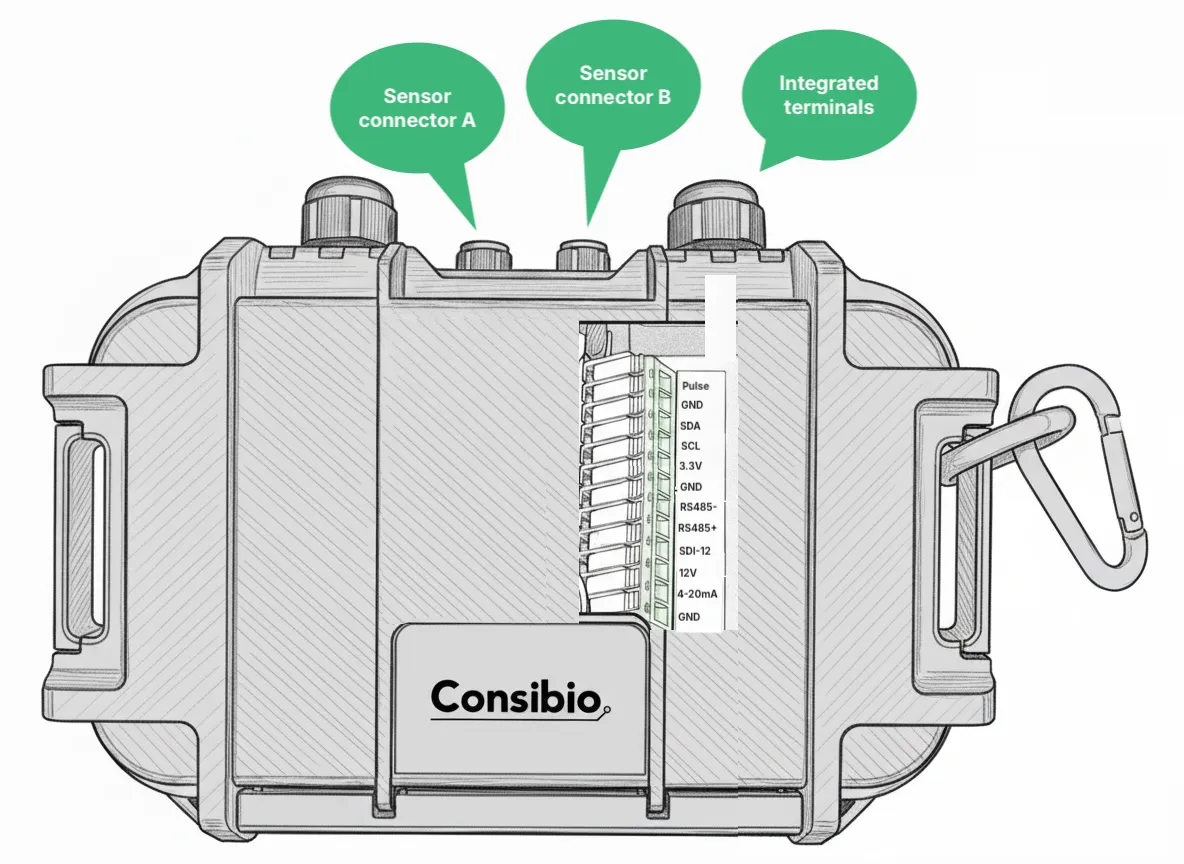 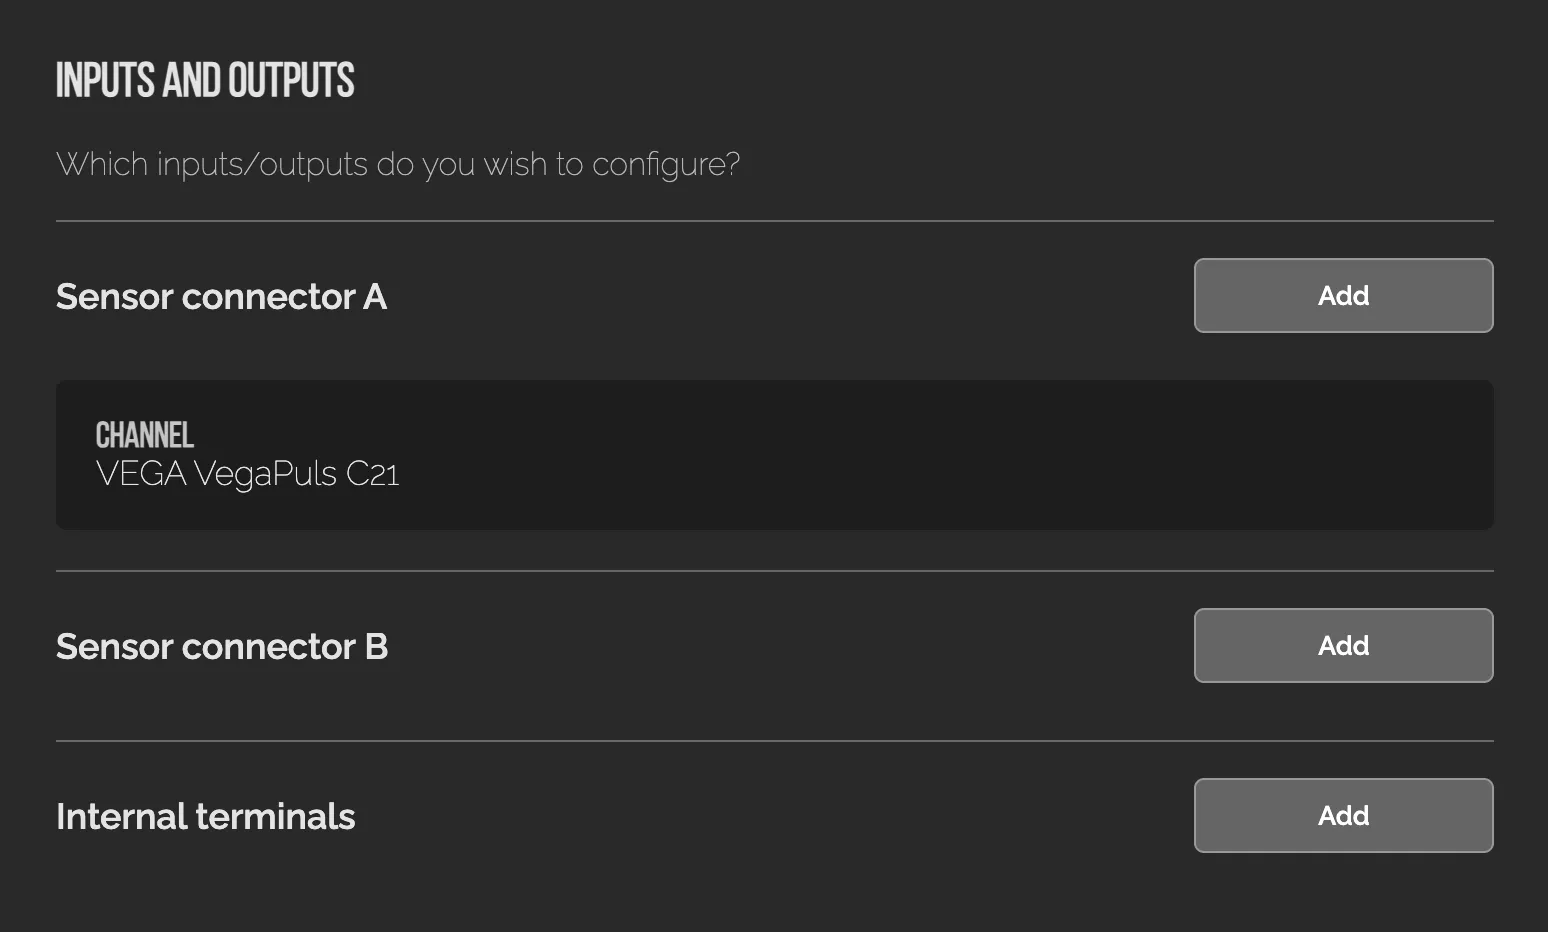 Roll up any excess cable and tie it to the eyebolt behind the Logger. 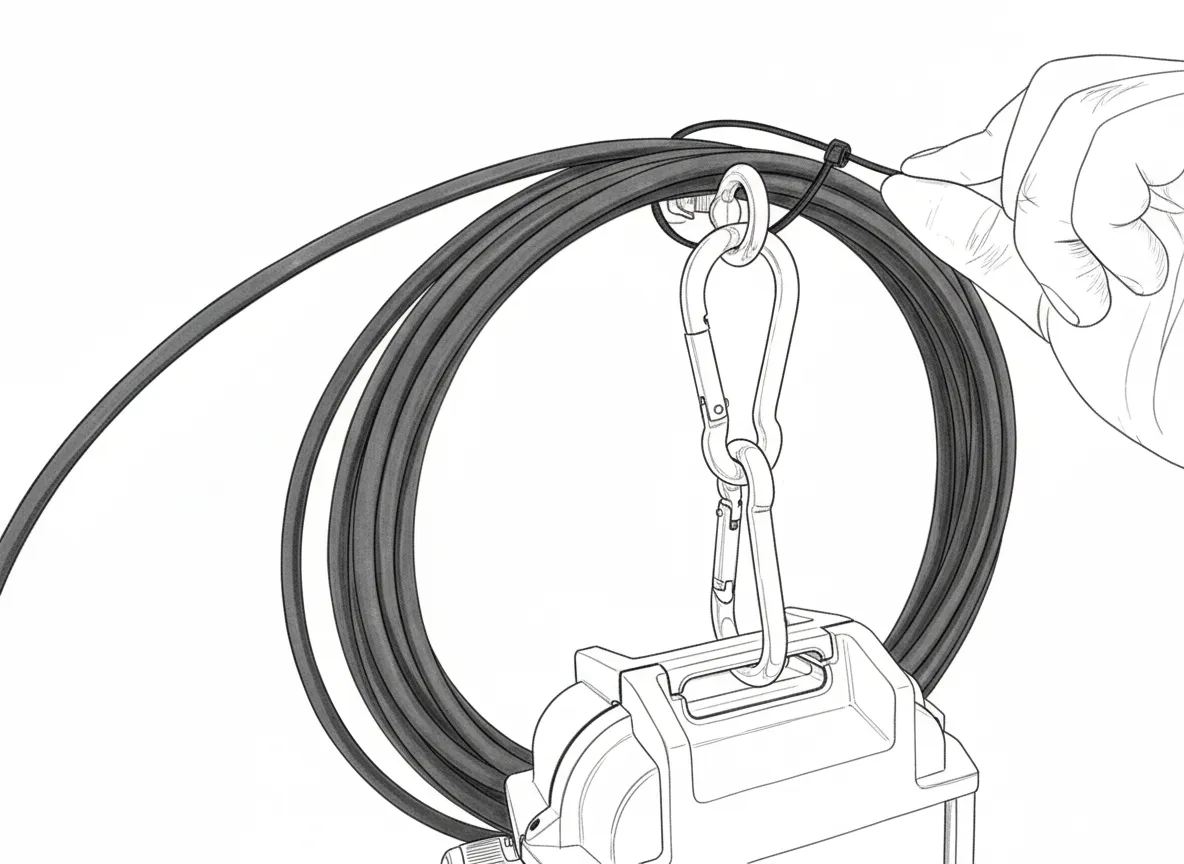 ### 2.4 Record installation dimensions [Section titled “2.4 Record installation dimensions”](#24-record-installation-dimensions) To calculate flow, we need 3 dimensions for the given site: * **A, Installation height** — distance from sensor to bottom of invert (measured on-site). * **D, Pipe diameter** — looked up in the documentation for the manhole. * **S, Slope of pipe** — looked up for the manhole. 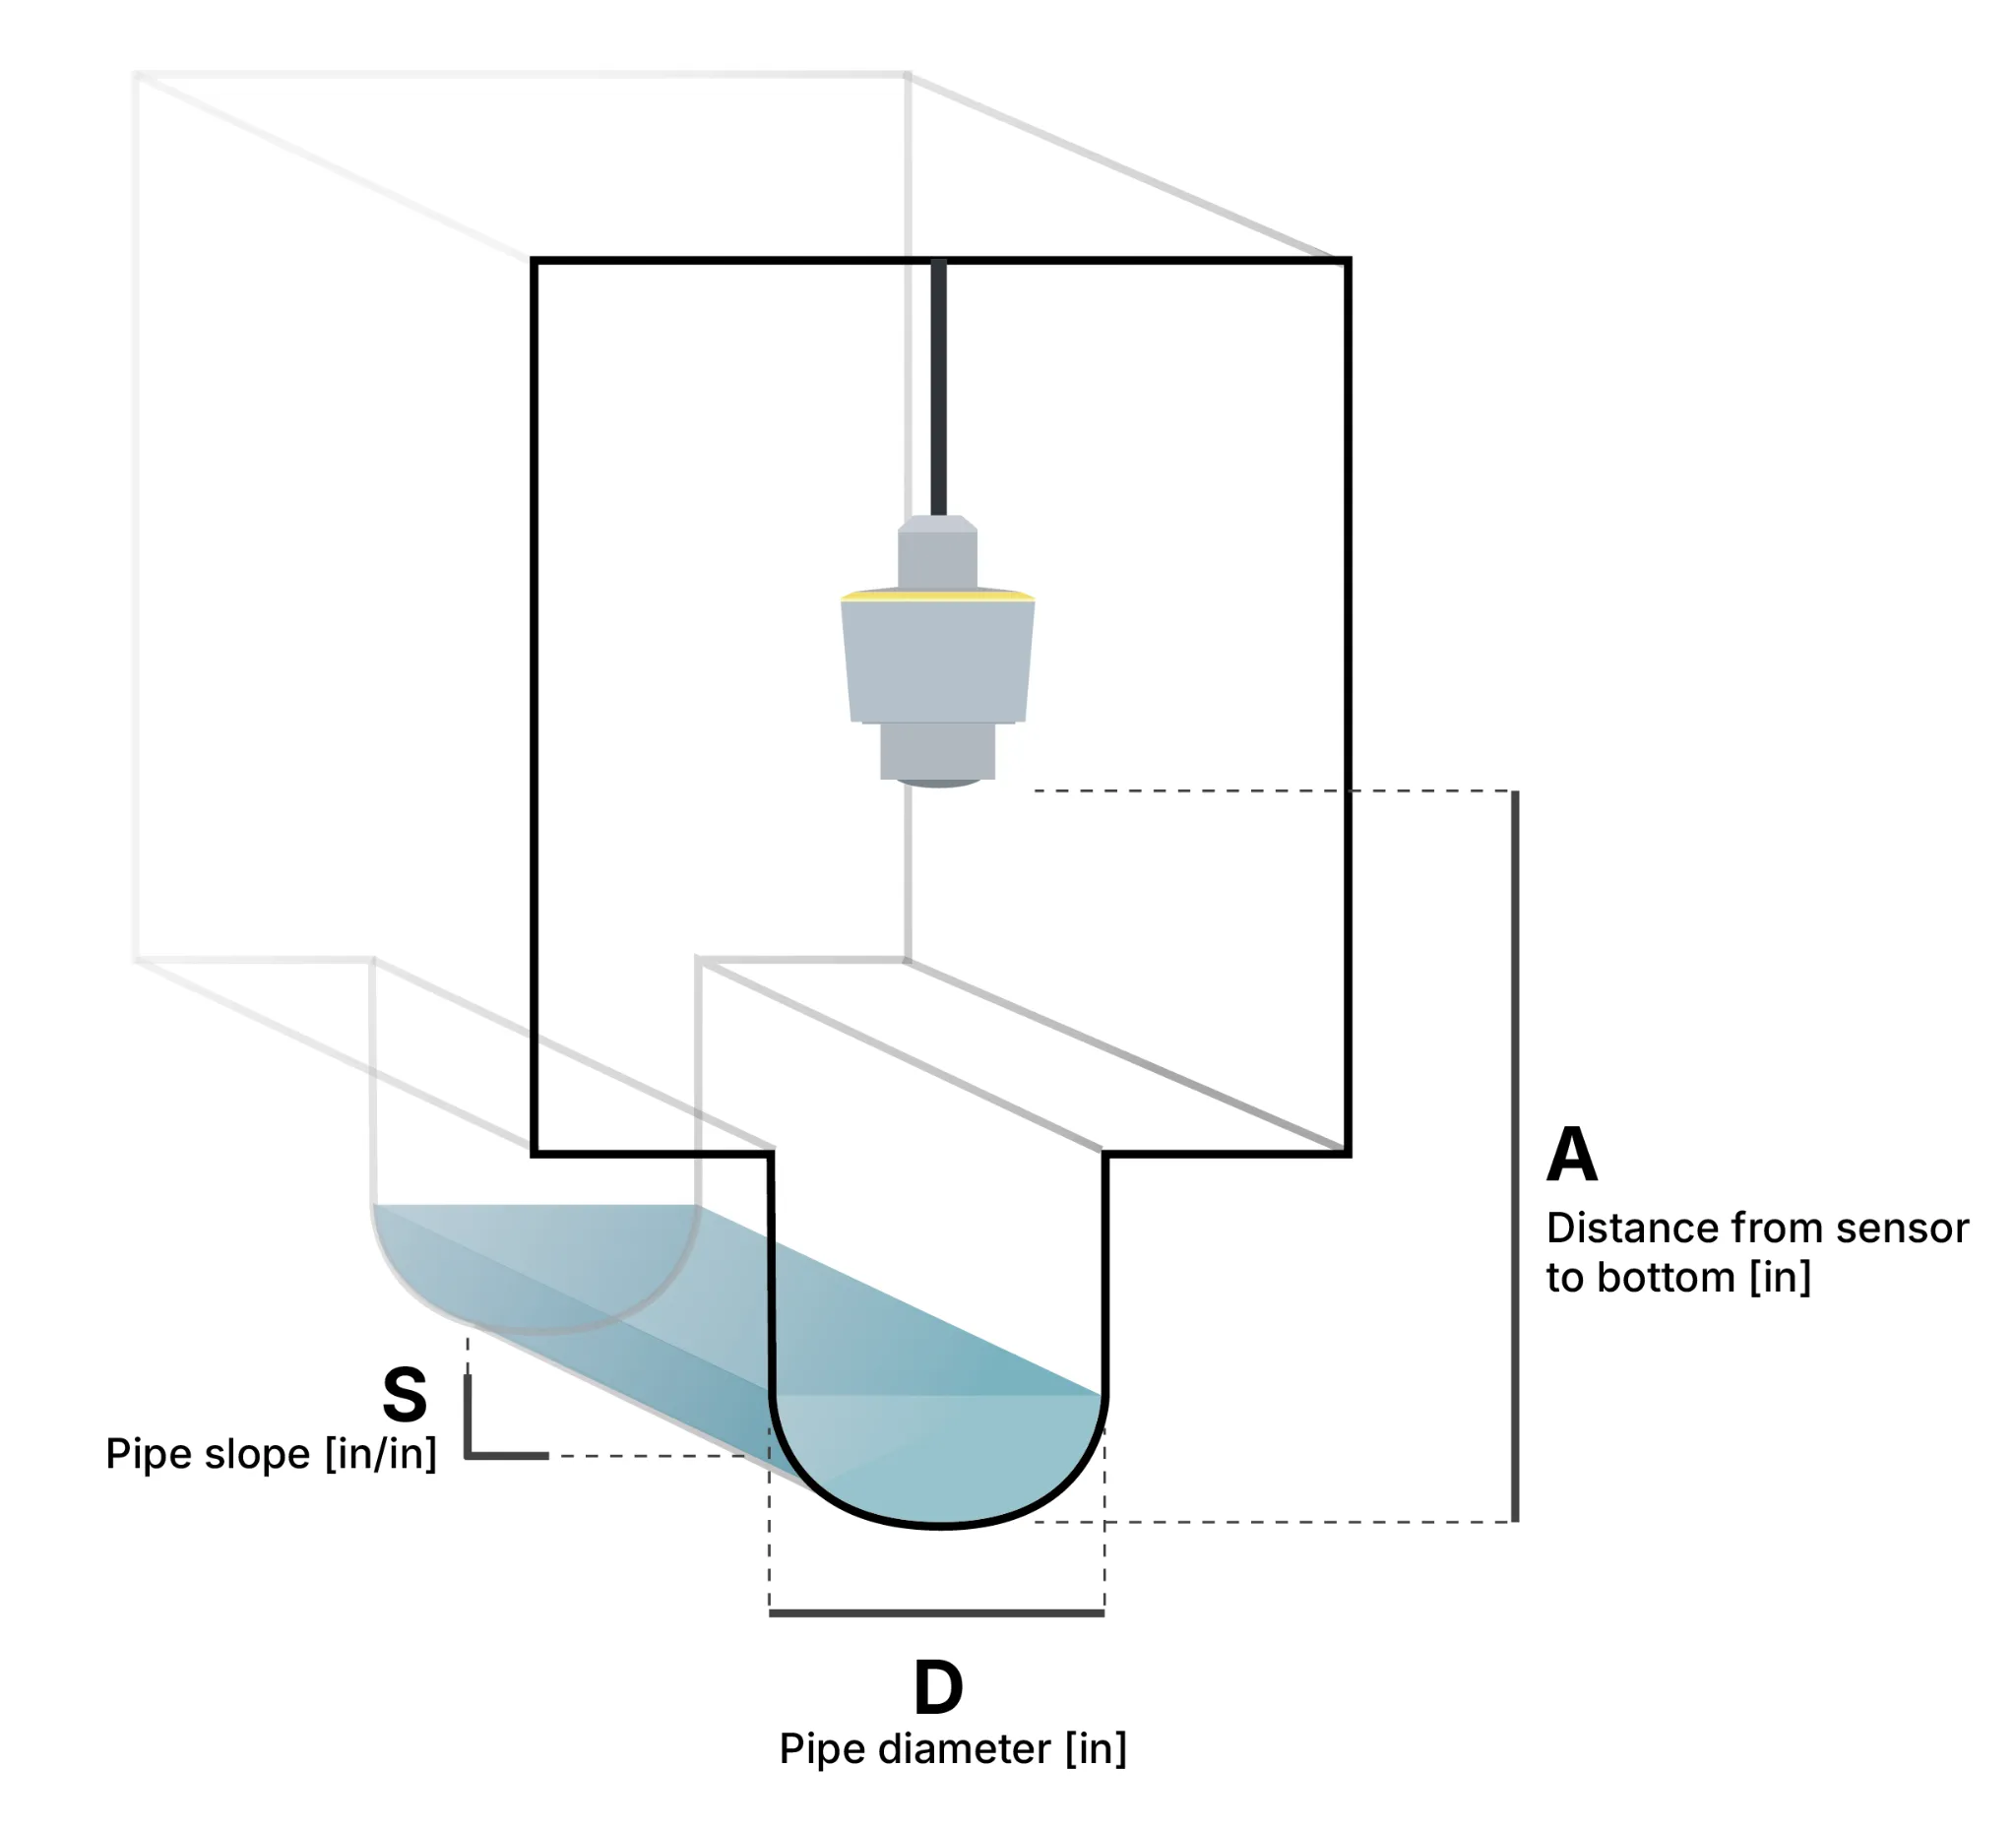 You need three different measures to properly calculate the flow from the sensor readings: * **A**: The installation height, i.e. the distance from the **bottom** of the sensor to the **bottom** of the invert (in inches). * **D**: The pipe diameter (in inches). * **S**: The slope of the pipe (inch / inch). The diameter (**D**) and the slope (**S**) can usually be looked up in the pipeline documentation. The installation height (**A**) has to be measured manually after installing the sensor. It is very important that this measure is as accurate as possible, because it will directly affect the accuracy of the flow. There are two ways to get an accurate installation height: 1. **Most practical: measure the current water level with a long rod.** After the device has been deployed, and you have ensured that it is transmitting while inside the manhole, put a long rod into the bottom of the manhole and pull it back up. Measure how far the rod was wetted and note down the exact time of the measurement. Then, go to Consibio Cloud and check the distance output of the sensor (i.e. the distance from the sensor to the water surface). The installation height (**A**) is the sum of these two measures: **A = water level \[in] + distance \[in]** (at the same time of the water level measurement). You are also more than welcome to send the measured **water level** and the **time of measurement** to our support team, and they will help set the rest up: . 2. **Less practical: direct measurement.** If there is not much water in the pipe, and you are doing a confined space entry in the manhole, you can measure the distance between the bottom of the invert and the bottom of the sensor directly with a ruler or measuring tape. When you have these measures, go to Virtual Sensors and enter them in the Virtual Sensor for flow calculation. ## 3. Verify installation and data quality [Section titled “3. Verify installation and data quality”](#3-verify-installation-and-data-quality) After installation is done, put the manhole cover back on and wait 5 minutes. We activated **Deploy Mode** in the first step, so the Logger will attempt to connect every **5 minutes**. Before leaving the site, you should verify that the Logger transmits correctly through the manhole cover, so it’s important to wait for long enough to verify this. Go to on a smartphone or laptop, log in to your project and check that data is coming in. If you don’t get a signal after closing the manhole cover, you can install an external antenna. ## Troubleshooting [Section titled “Troubleshooting”](#troubleshooting) * **No signal after closing the manhole cover** — install an external antenna. Reach out to if you need assistance. * **Flow readings look inaccurate** — double-check the installation height (**A**), pipe diameter (**D**) and slope (**S**) entered in the Virtual Sensor; an inaccurate installation height is the most common cause of flow calculation errors. Reach out to if you need assistance.
# Installing the Rain Gauge solution
> Mount and connect a Consibio Rain Gauge with a Logger WD-68 datalogger, and verify it's reporting data.
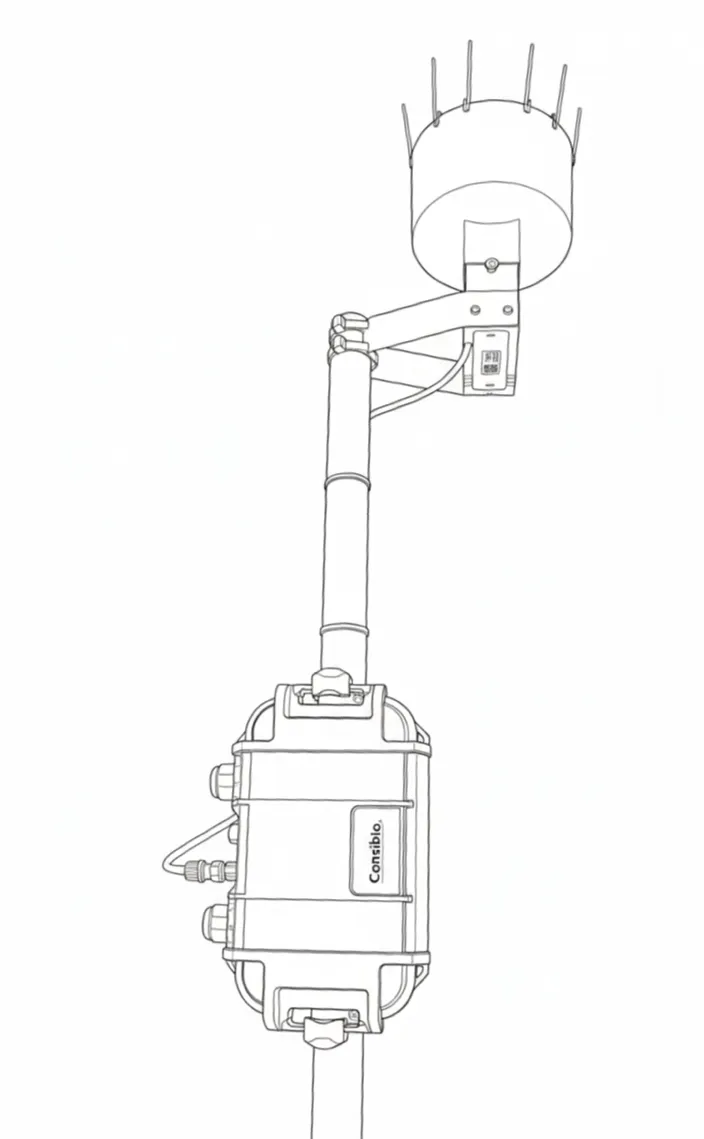 ## Equipment [Section titled “Equipment”](#equipment) The Consibio Rain Gauge solution consists of all the equipment and accessories needed to install a rain precipitation monitoring system: * Logger WD-68 battery-driven cellular datalogger * Rain Gauge * Leaf grid and bird spikes for rain gauge * Brackets for mounting the rain gauge on a pole * Mounting brackets for mounting the Logger on a pole ## 1. Activate Deploy Mode [Section titled “1. Activate Deploy Mode”](#1-activate-deploy-mode) The first thing to do when arriving on the site of installation is to activate **Deploy Mode** on the Logger: 1. Press “Restart” shortly. 2. Hold “Deploy Mode” for approximately 5s. When the LEDs flash quickly one at a time in a repeating pattern, Deploy mode is activated.  For the next **1 hour**, the device will make a **measurement every 30s** and **transmit every 5mins**. After 1 hour, it will revert to the transmission and measurement interval configured in Consibio Cloud. We activate this as the first step to make the Logger start connecting immediately, where it will scan the local network operators and select the most optimal one. On the first attempt, this can take some minutes. ## 2. Mounting instructions [Section titled “2. Mounting instructions”](#2-mounting-instructions) ### 2.1 Install bird spikes and leaf grid on rain gauge [Section titled “2.1 Install bird spikes and leaf grid on rain gauge”](#21-install-bird-spikes-and-leaf-grid-on-rain-gauge) The bird spikes and leaf grid are not mounted on the rain gauge during shipping, so these should be installed first. Install the first 3 bird spikes by pushing them over the side of the rain gauge. They should be positioned at 12 o’clock, 4 o’clock and 8 o’clock. 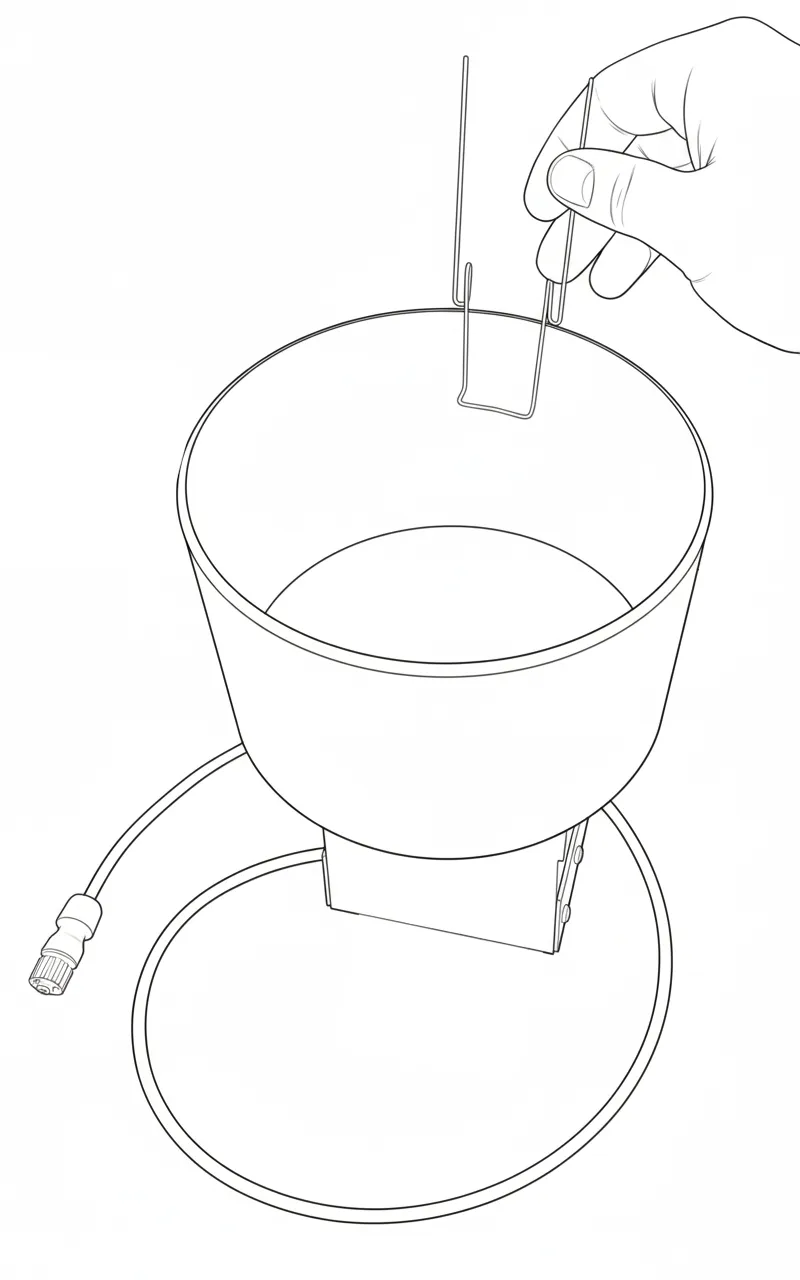 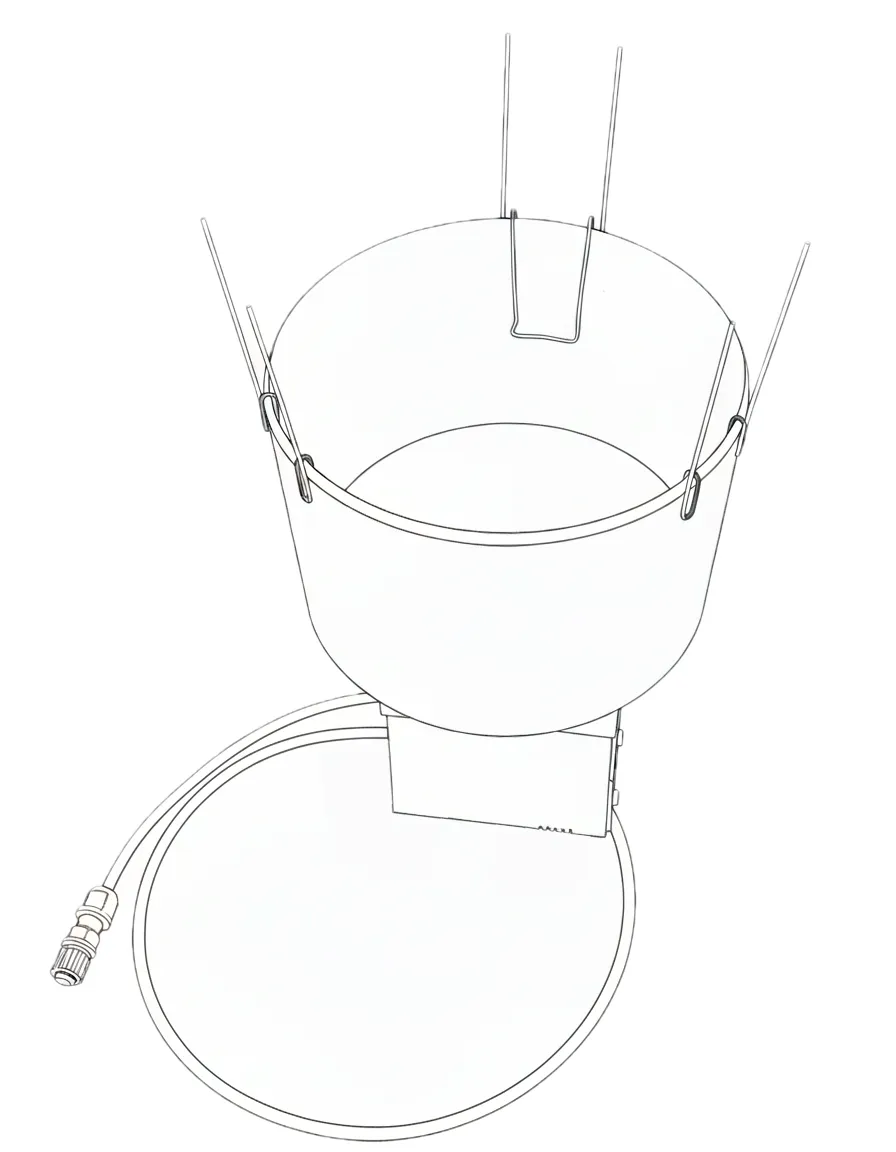 Next, place the leaf grid on top of the bottom holders of the spikes: 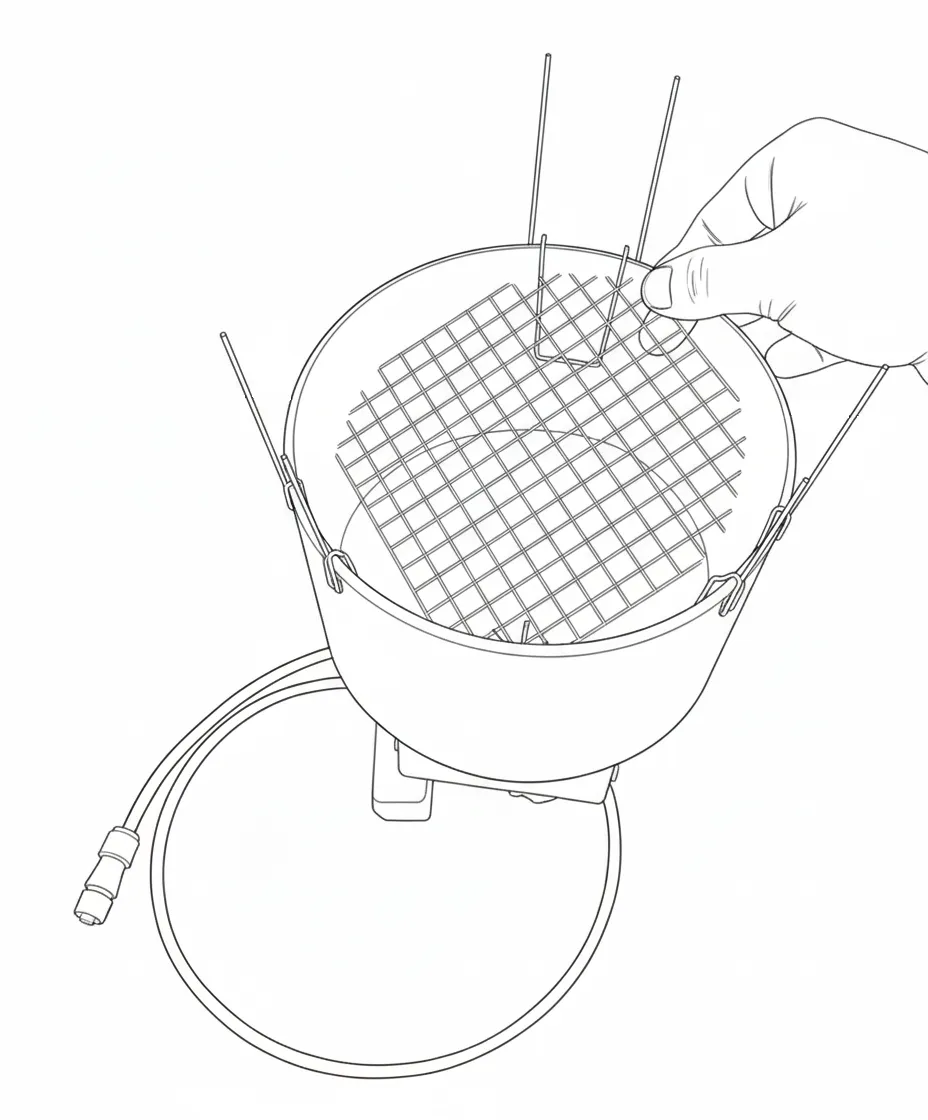 Now install the rest of the spikes on top of the grid, locking it in place: 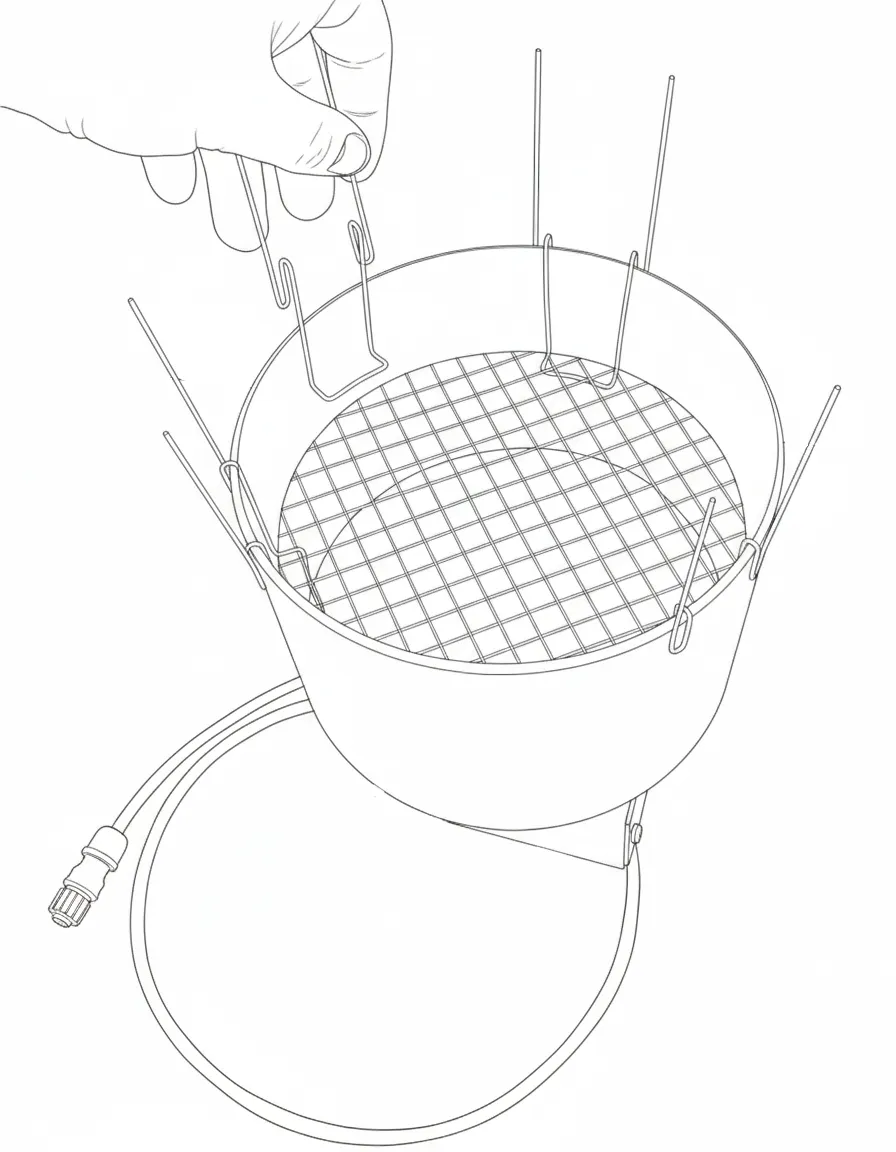 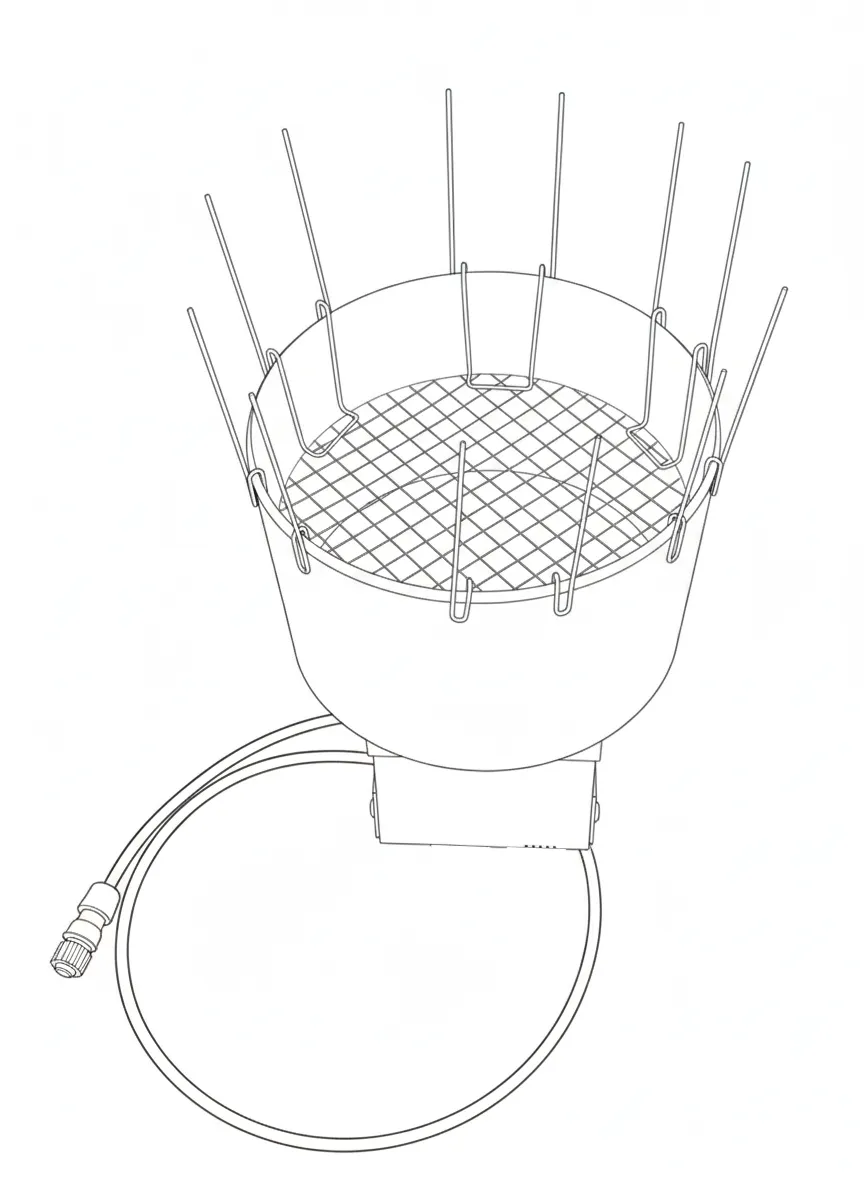 ### 2.2 Mount the rain gauge on a pole [Section titled “2.2 Mount the rain gauge on a pole”](#22-mount-the-rain-gauge-on-a-pole) The rain gauge should be mounted on an appropriate pole (the pole is not included in the kit). For the most accurate rain metering, keep the following best practices in mind for the installation: * The gauge should be mounted at least 1m / 3ft above the ground to avoid collecting any splashes. * Mount the gauge as far as possible from walls, trees or other obstructions that might limit the free path of rainfall into the gauge. * The gauge should be level after installation. Mount the gauge on the pole using the included bracket and a worm drive clamp that fastens the bracket onto the pole: 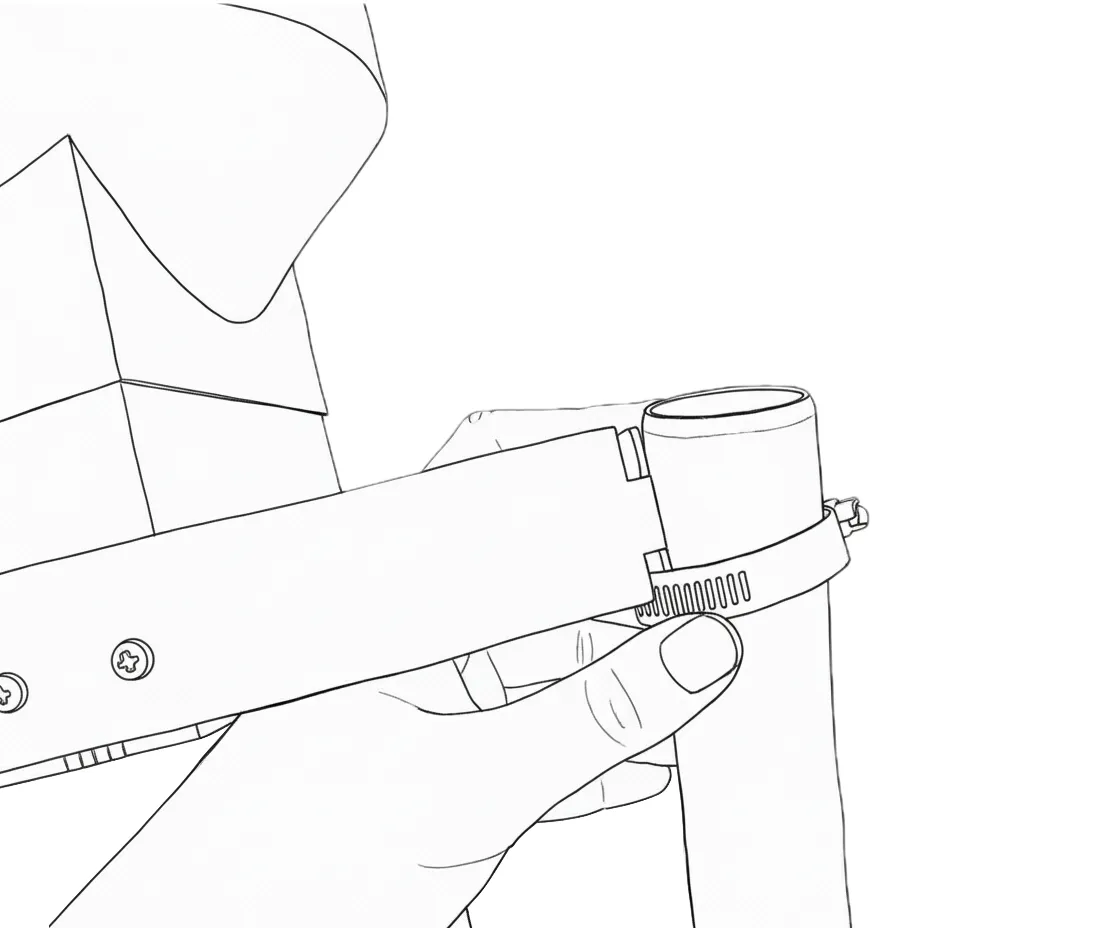 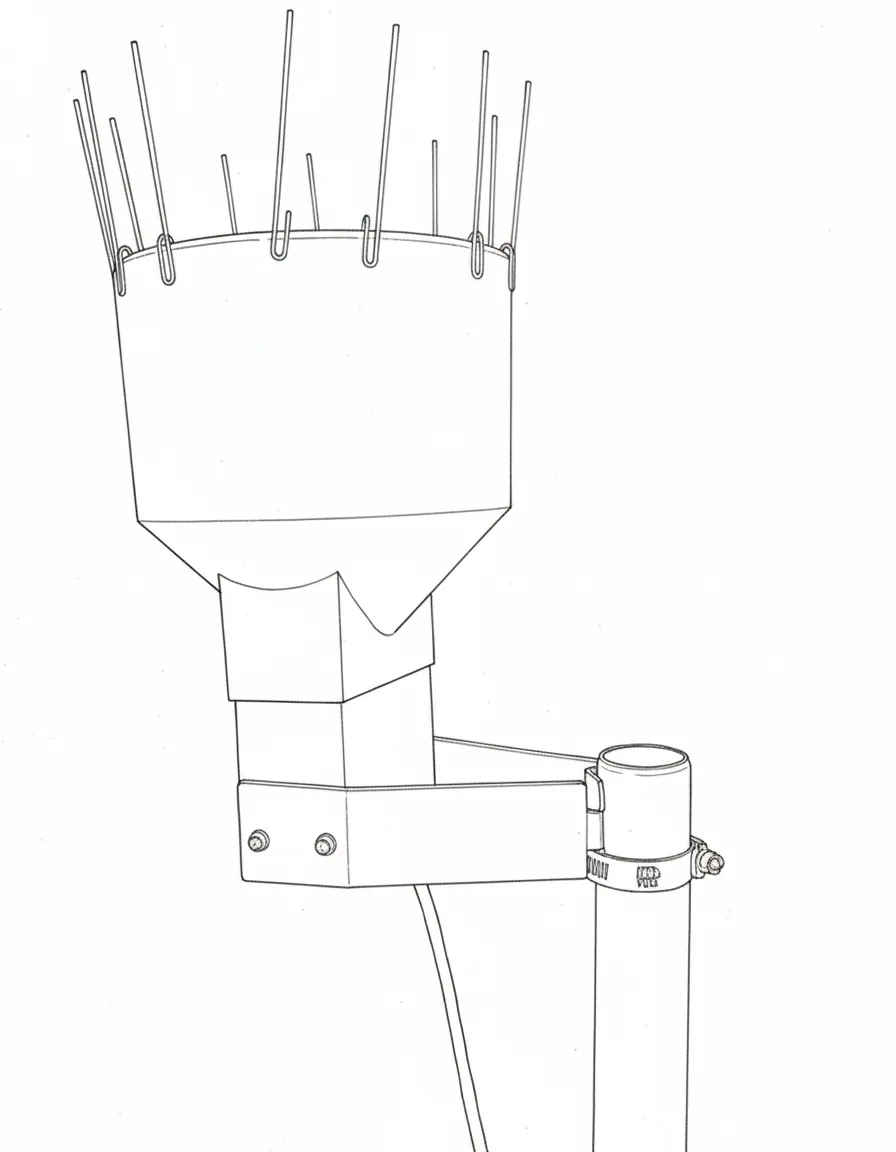 ### 2.3 Attach pole mount brackets to the Logger [Section titled “2.3 Attach pole mount brackets to the Logger”](#23-attach-pole-mount-brackets-to-the-logger) Take off the carabiners attached to the Logger: 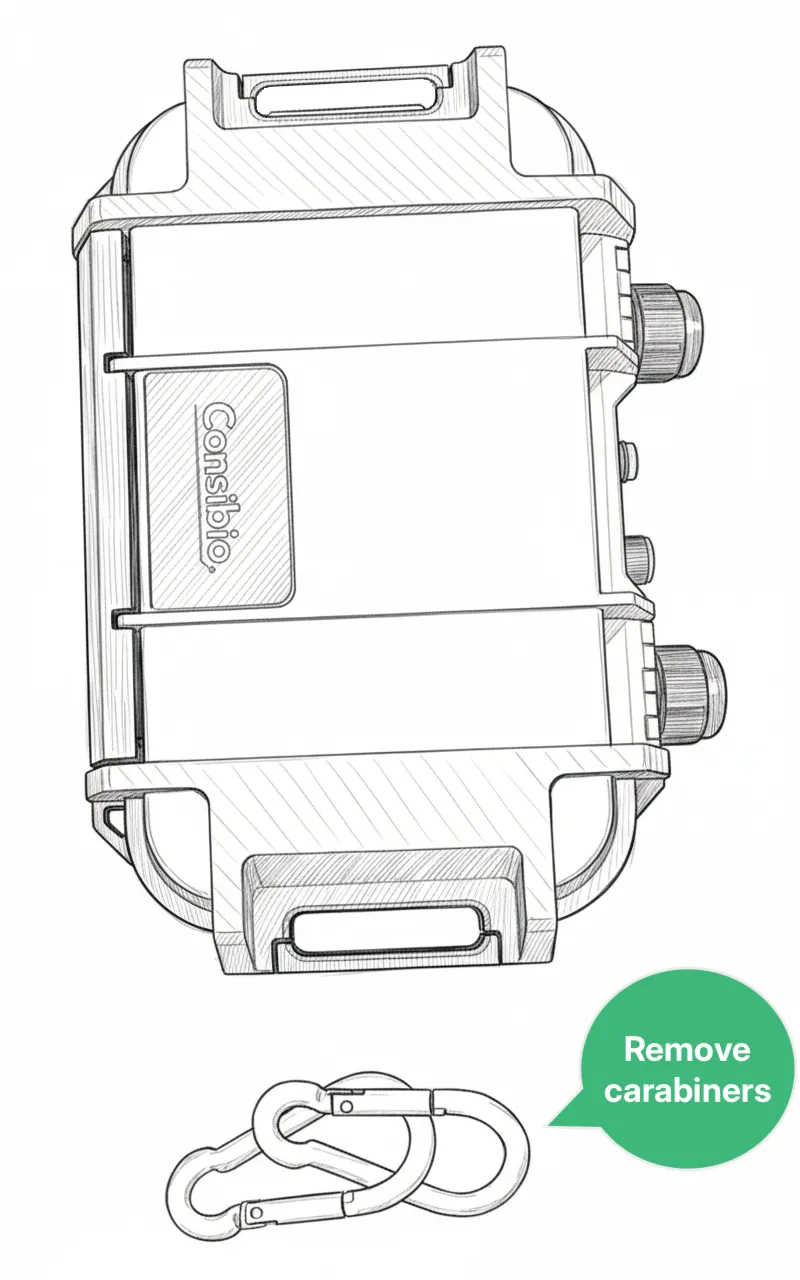 Install the pole mounting brackets for the Logger included with the rain gauge pack. Push the bracket over the bar on the side of the Logger and push it all the way down: 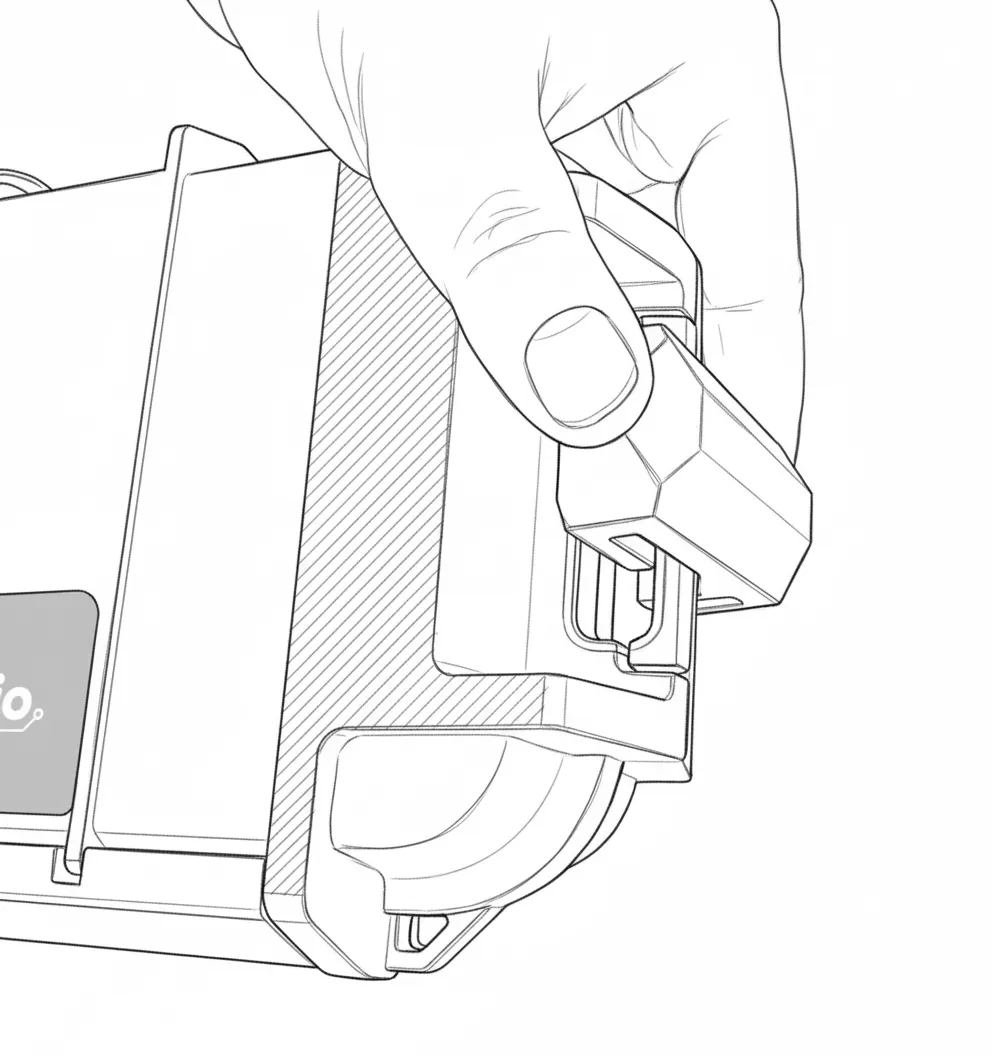 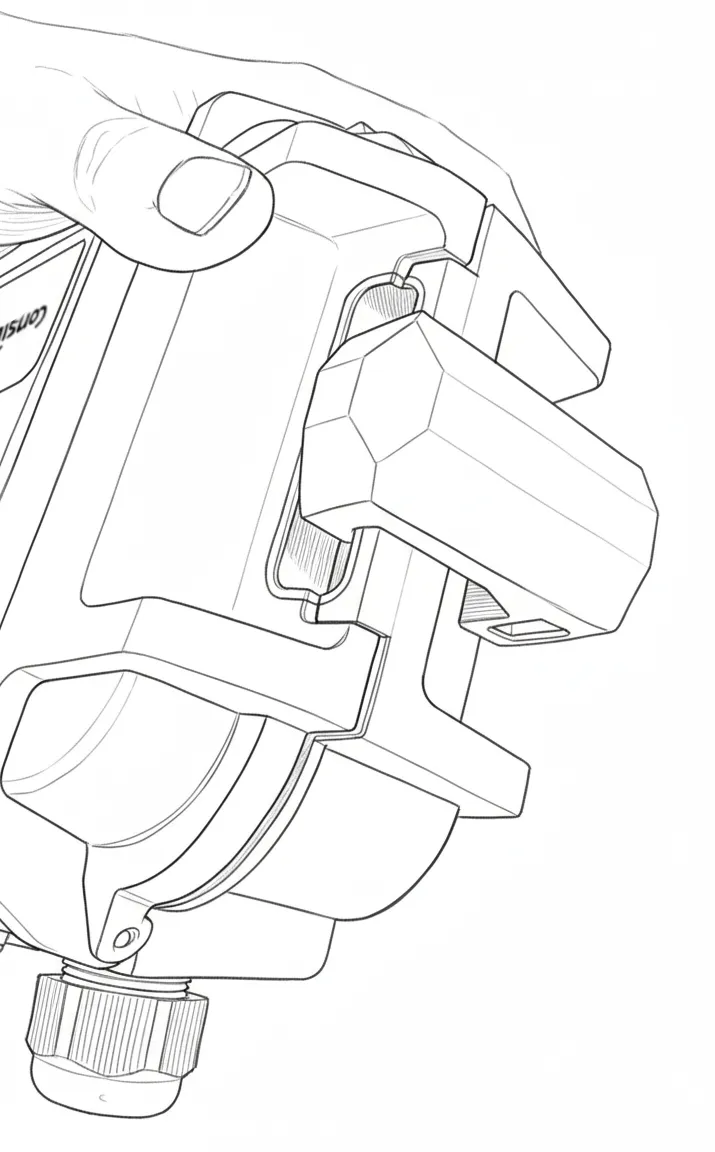 Now do the same for the other side, so a bracket is mounted on both side bars of the Logger: 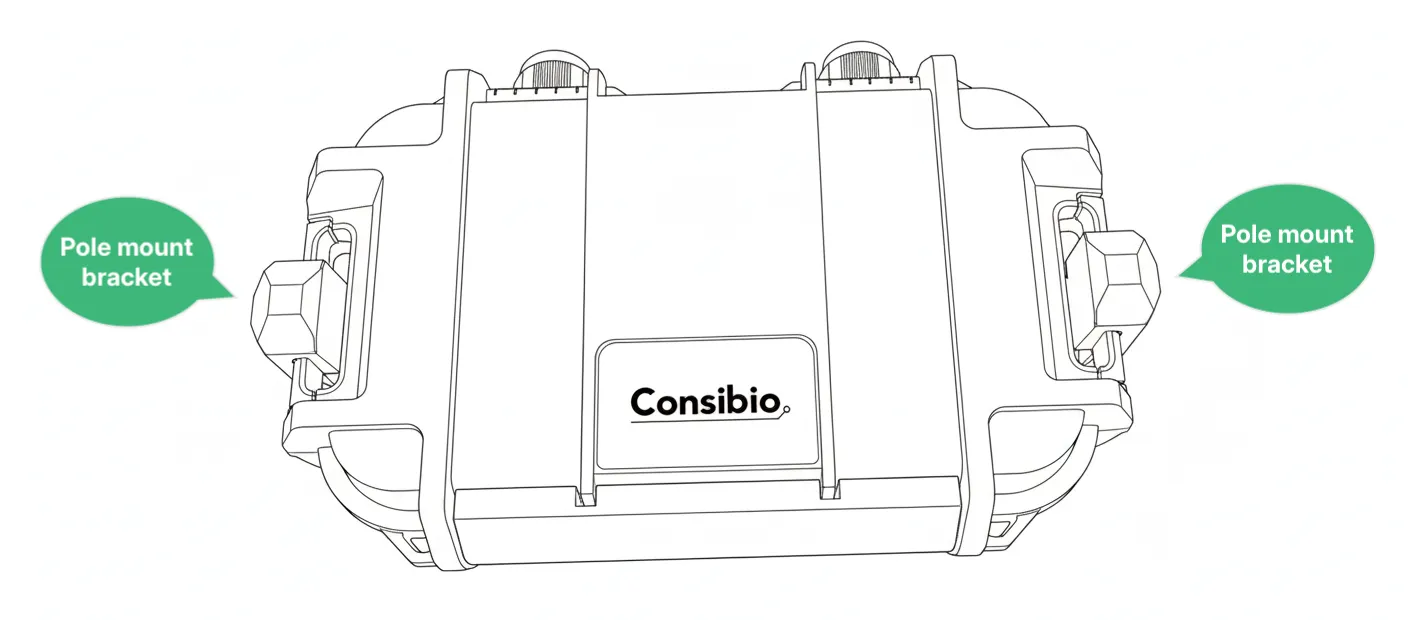 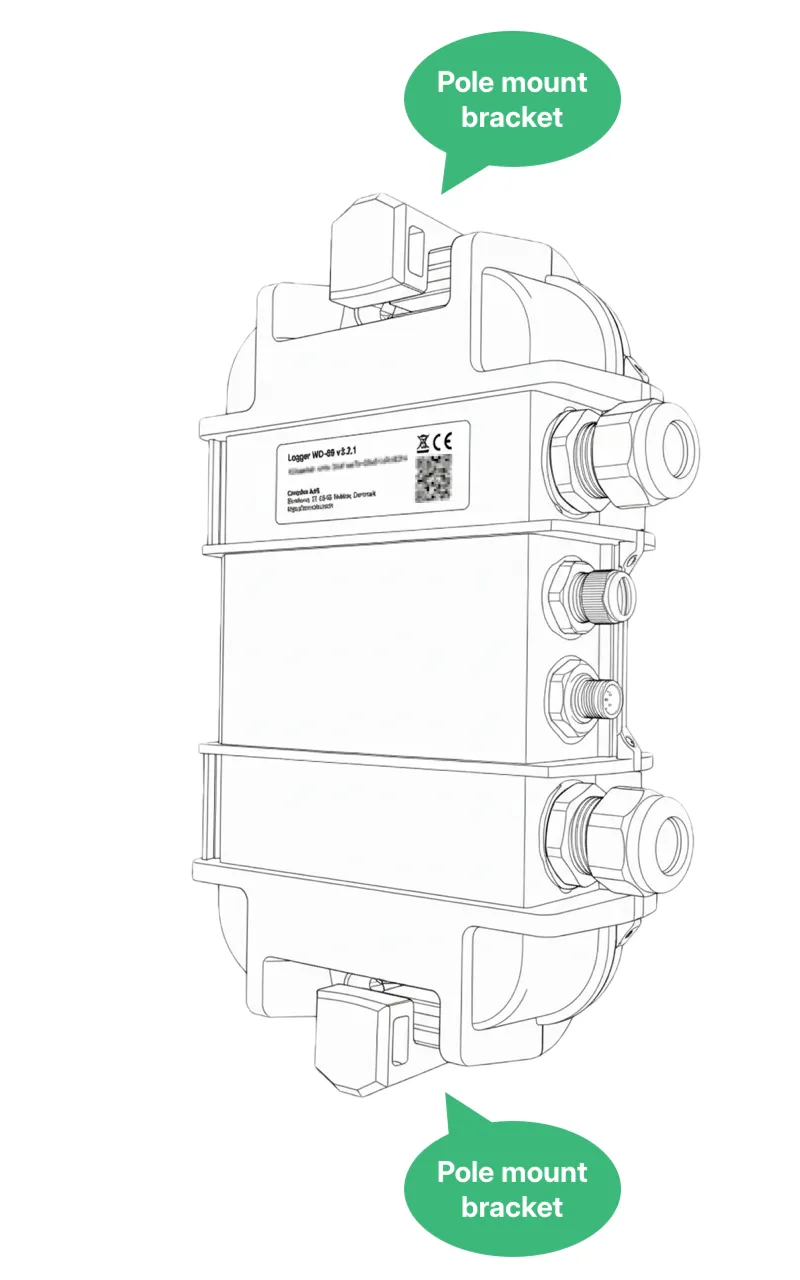 ### 2.4 Mount the Logger on the pole [Section titled “2.4 Mount the Logger on the pole”](#24-mount-the-logger-on-the-pole) Insert a worm drive clamp through the slot in both pole mount brackets: 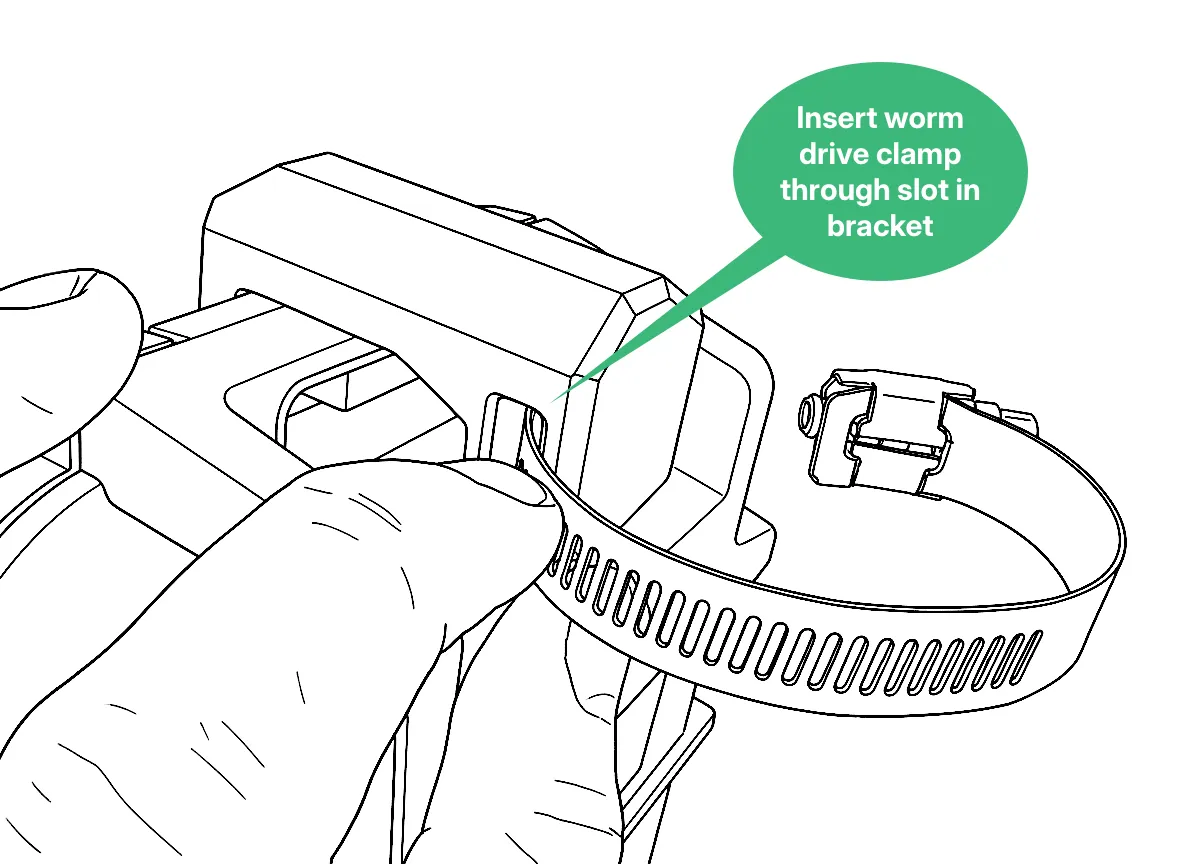 Route the worm drive clamp around the pole and fasten it. It’s **important not to fasten it too tight**. Try fastening it bit by bit while assessing if the Logger is properly secured. Once it’s no longer easily movable by hand, the clamp is sufficiently tight. 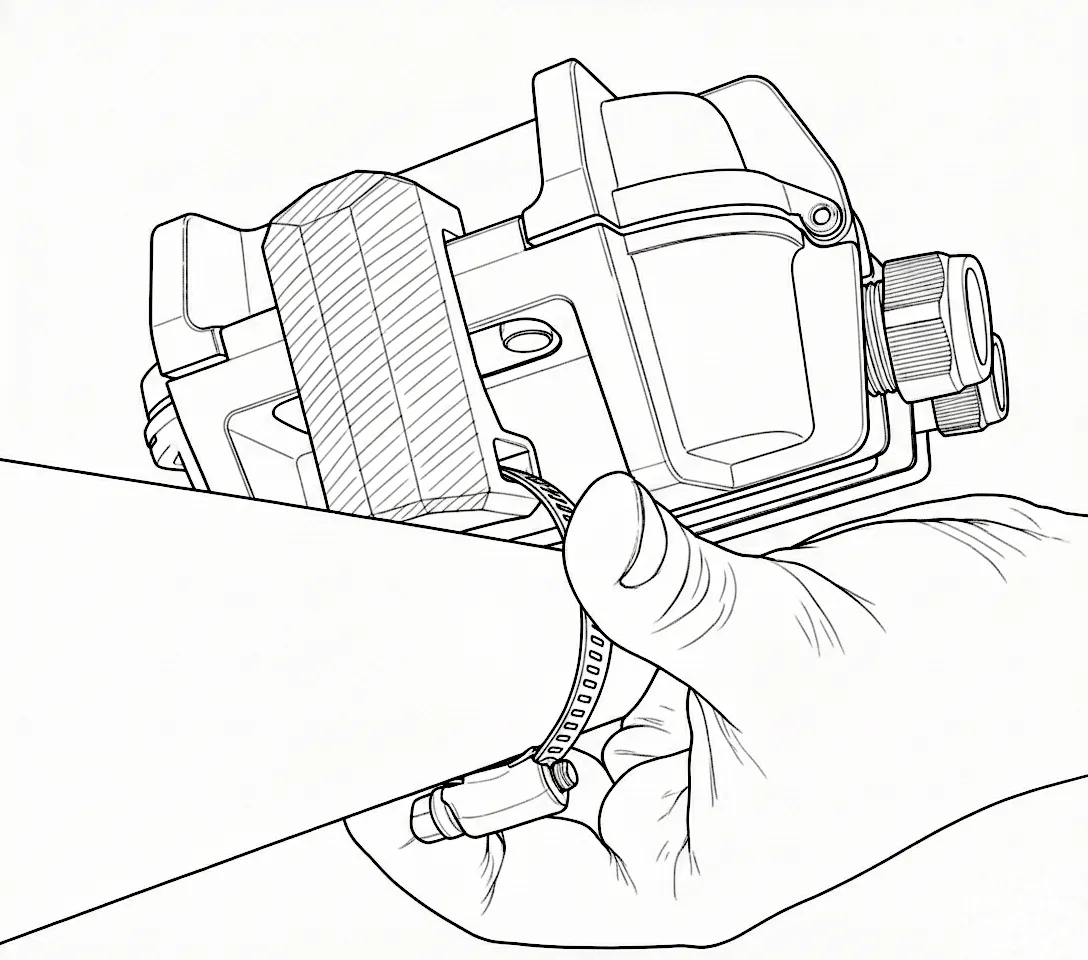 Repeat the process for the pole mount bracket at the bottom of the Logger so it’s mounted on both the top and bottom: 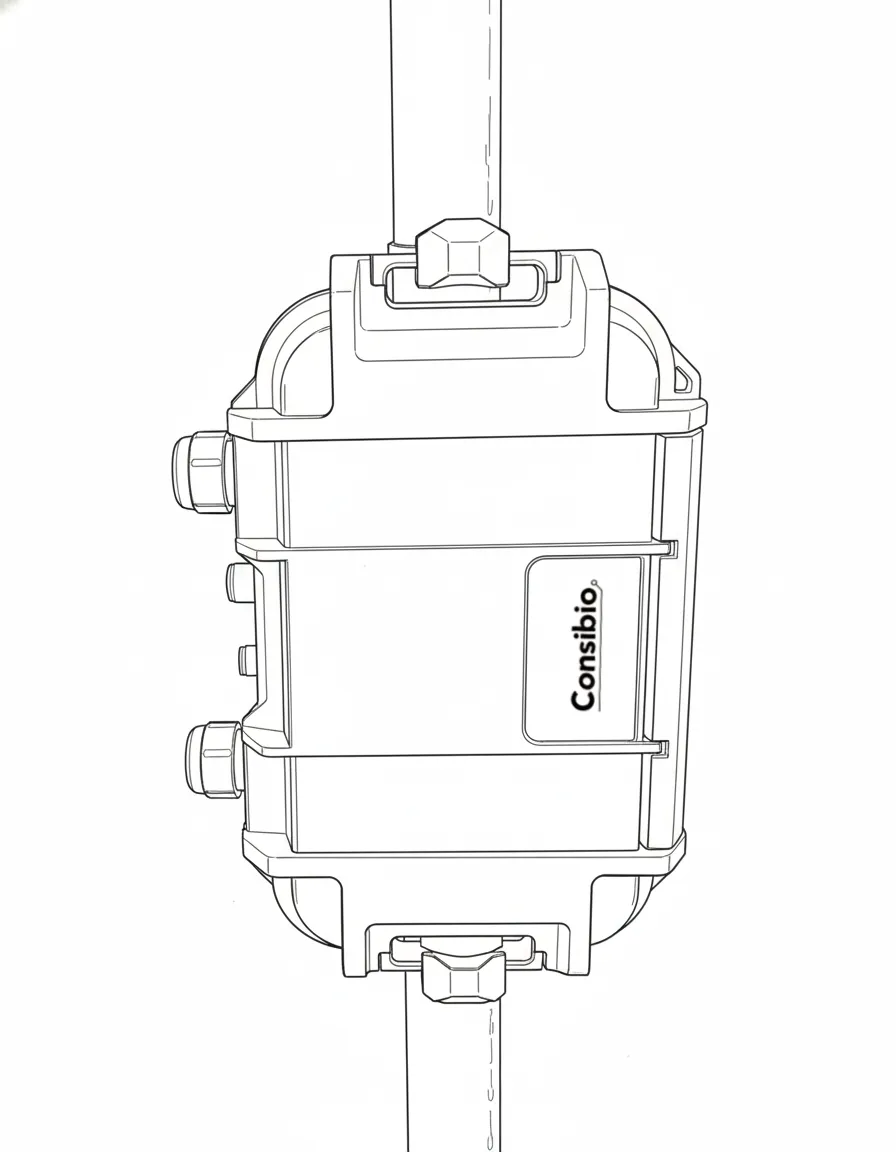 ### 2.5 Connect rain gauge cable to Logger [Section titled “2.5 Connect rain gauge cable to Logger”](#25-connect-rain-gauge-cable-to-logger) Connect the cable from the rain gauge to the Logger. Connect it to port A, unless otherwise specified: 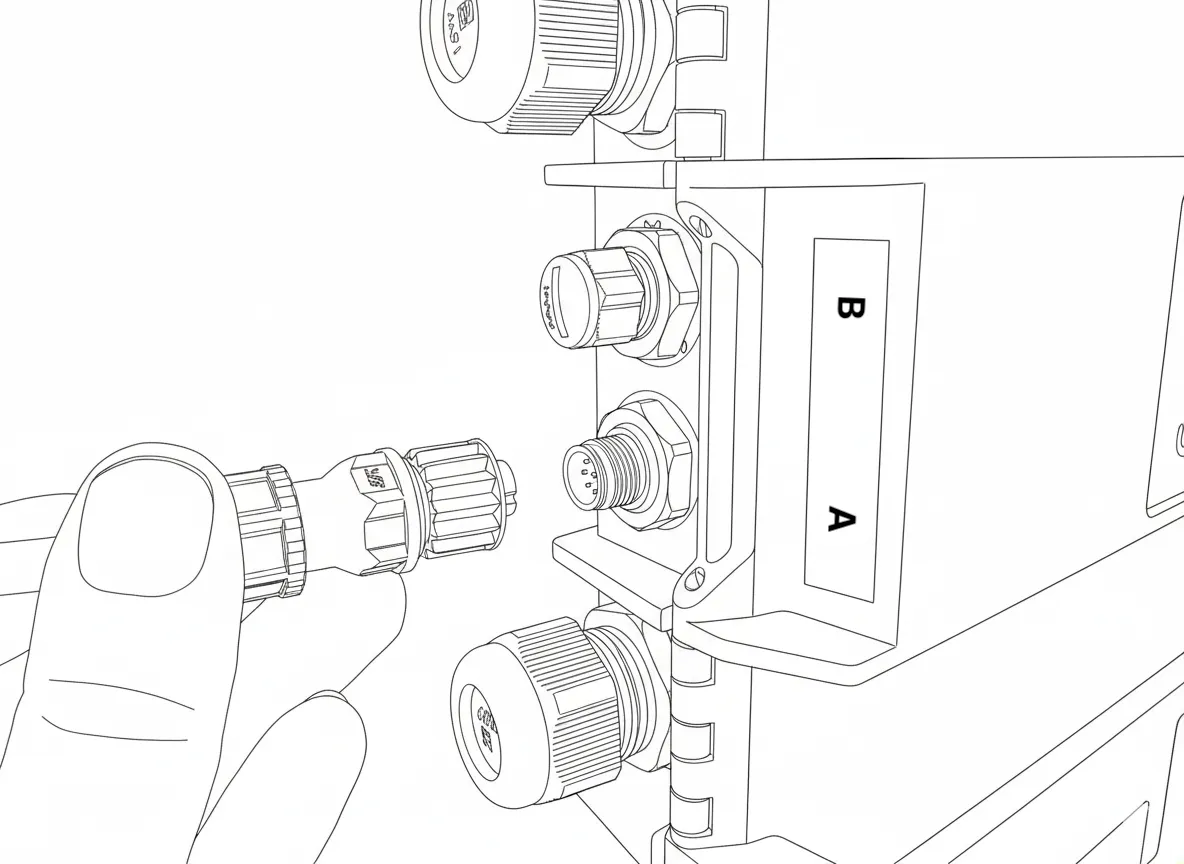 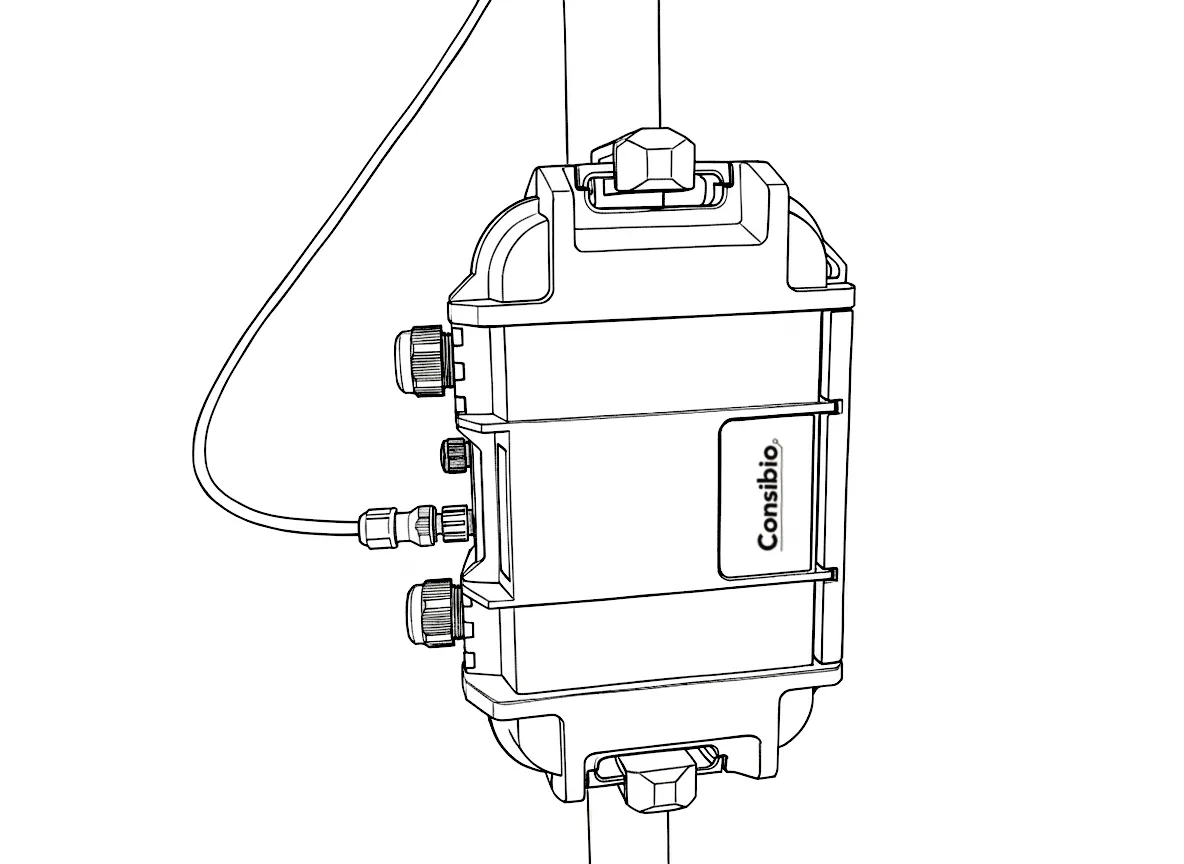 #### 2.5.1 Fasten the cable [Section titled “2.5.1 Fasten the cable”](#251-fasten-the-cable) Fasten the cable to the pole with zip ties to ensure a clean installation: 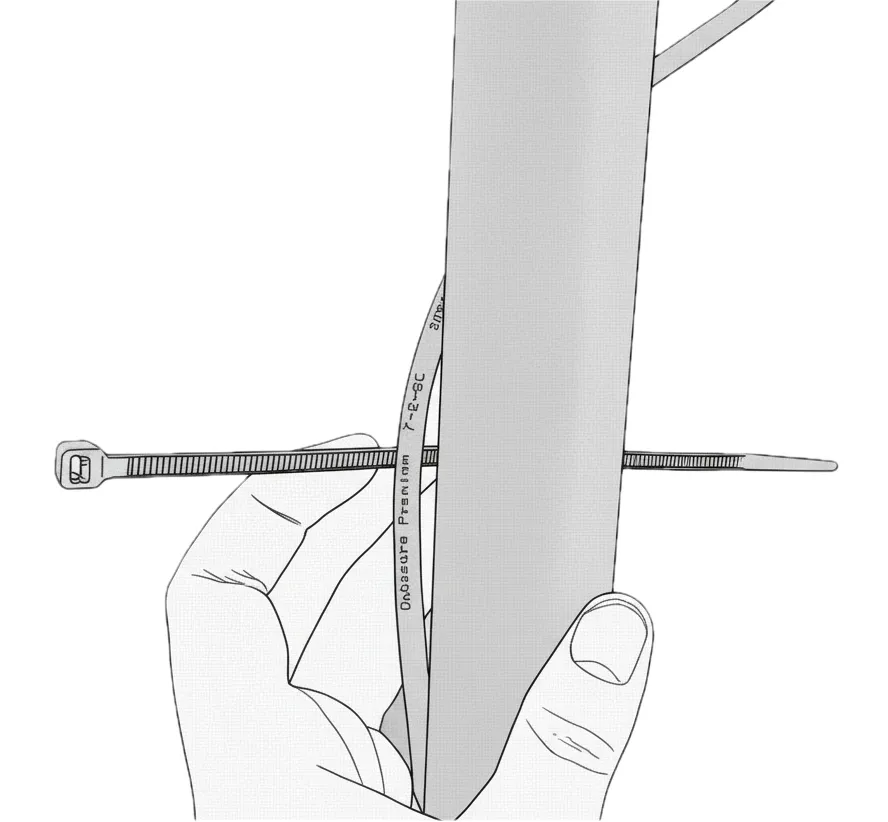 Now the installation is complete! 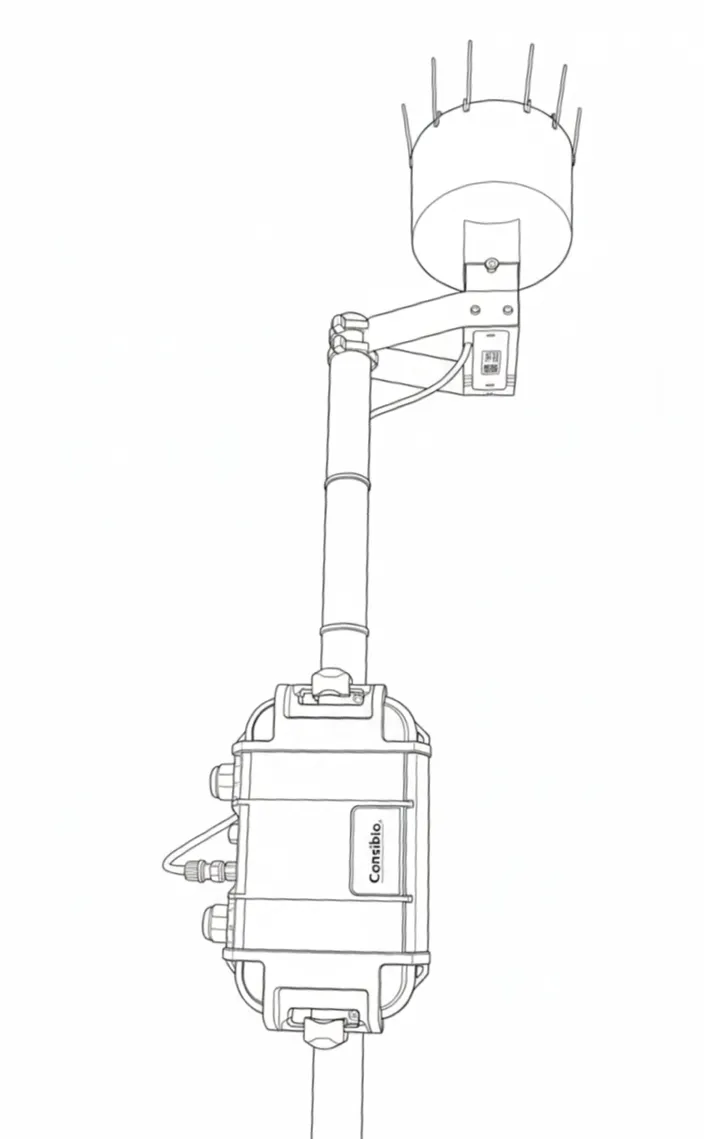 ## 3. Verify installation and data quality [Section titled “3. Verify installation and data quality”](#3-verify-installation-and-data-quality) After installation is complete, check that the Logger transmits data correctly. We activated **Deploy mode** in the first step, so the Logger has since then attempted to connect every **5 minutes**. Before leaving the site, verify that the Logger transmits correctly, so it’s important to wait long enough to check this. Go to on a smartphone or laptop, open your project and check that the most recent measurement is recent — the most recent datapoint should have been recorded within the last couple of minutes. If you don’t get a signal from the Logger, try: * Activating deploy again, according to the instructions in step 1. * Moving the Logger as far away from large metal objects as possible. * Relocating the equipment to another location. Reach out to if you need assistance.
# Logger 4WD
> Specifications and capabilities of the Logger 4WD battery-driven cellular datalogger — connectivity, mechanical design, power options and I/O.
Logger 4WD is a battery-driven cellular datalogger for remote monitoring in a compact, weatherproof polycarbonate enclosure. It is sensor-agnostic and supports the most common industrial interfaces, so it can be used with any compatible sensor you might already own. Logger 4WD shares its electronics platform with the [Logger WD-68](/cloud/devices/logger-wd-68/) — the same connectivity, power options, I/O and internal measurements — housed in a compact wall-mountable polycarbonate case. 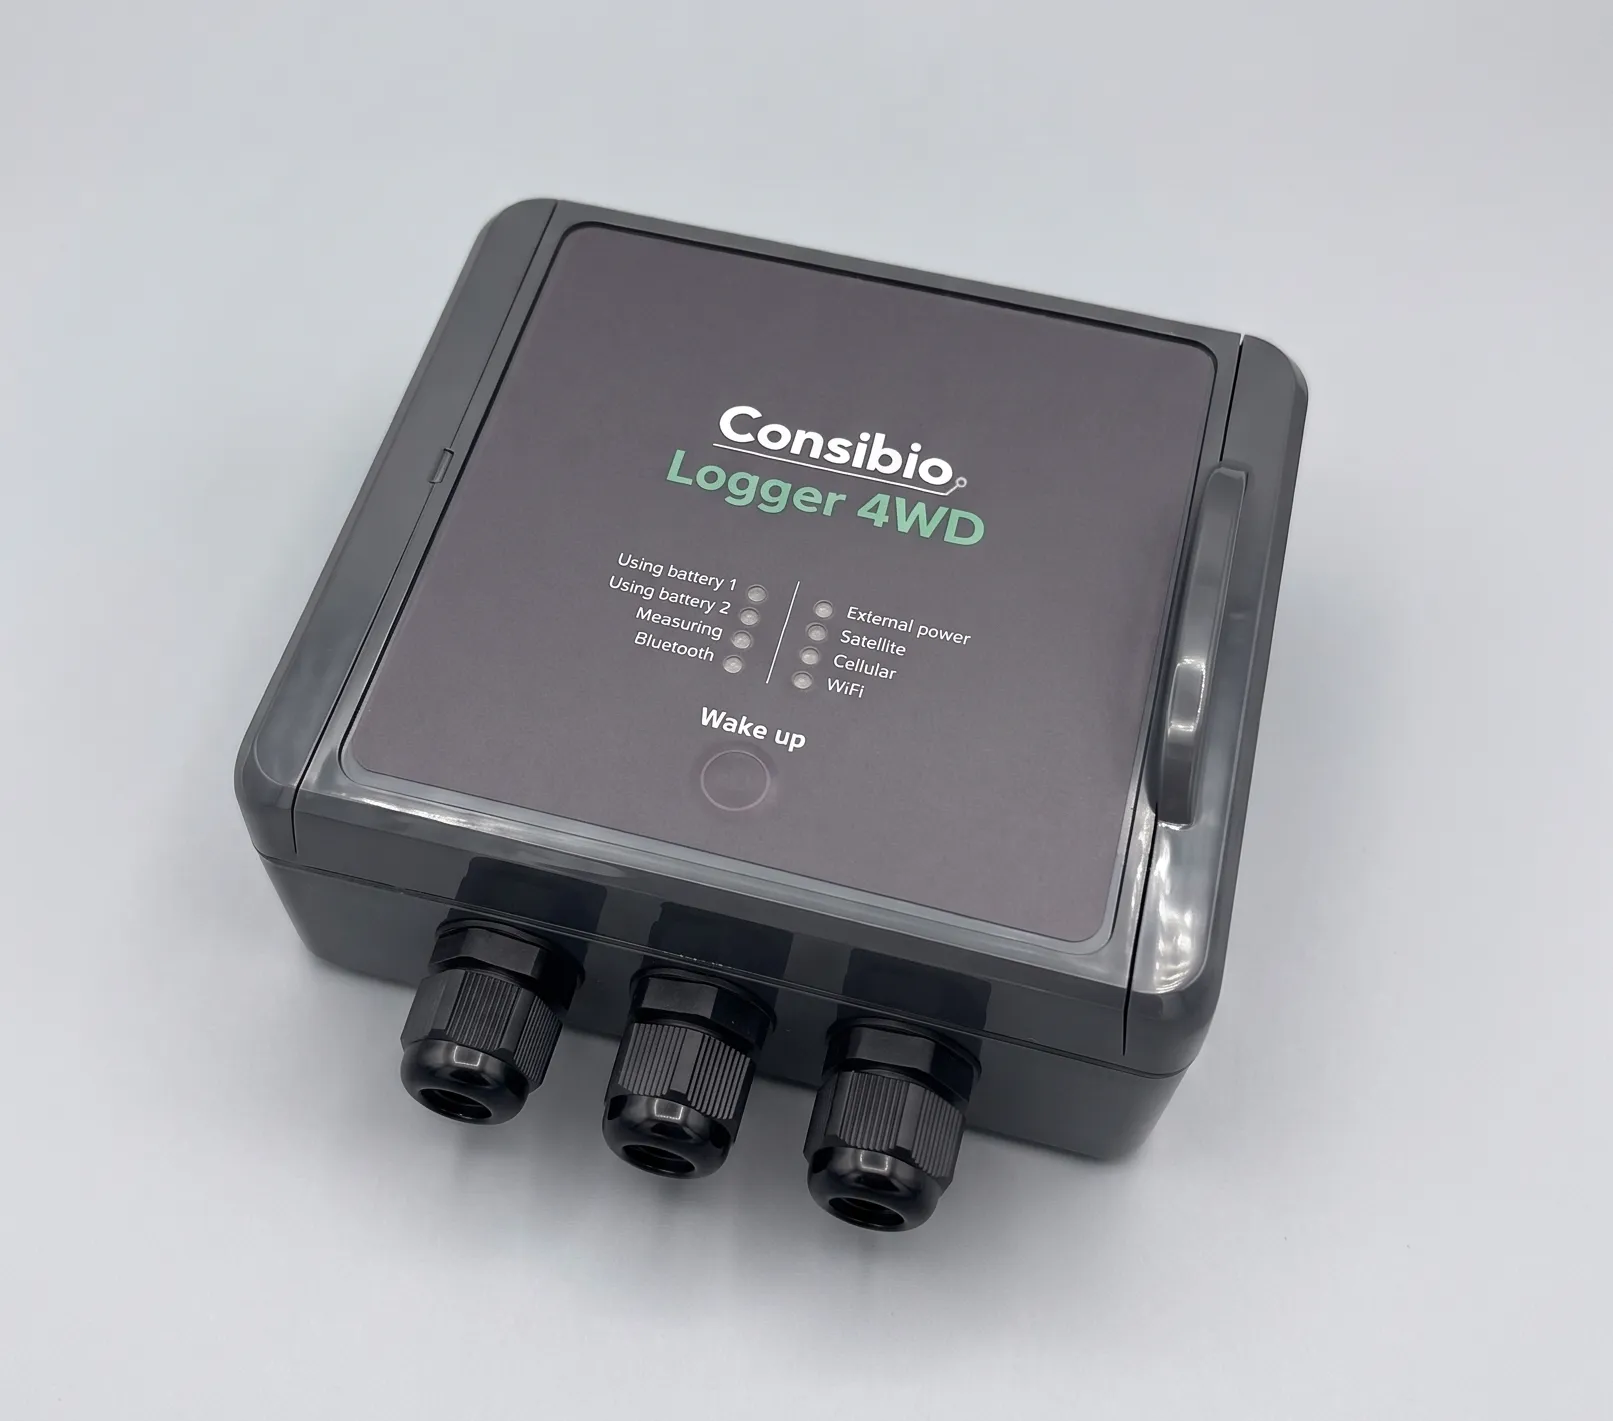 ## Specifications [Section titled “Specifications”](#specifications) ### Overall [Section titled “Overall”](#overall) | Parameter | Value | | ----------------- | -------------------------------------------------------------------------------------------------------------------------------------------- | | Expected lifetime | +10 years | | Guarantee | 1 year | | Connectivity | **Cellular:** LTE Cat-M1, NB-IoT (eSIM included; a custom nanoSIM can be inserted). **WiFi:** 2.4 GHz (802.11 b/g/n). **Add-on:** Satellite. | | Standards | DS/EN 61326-1:2013 | ## Cellular [Section titled “Cellular”](#cellular) One of the most crucial parts of remote monitoring is robust connectivity, because it ensures that data is transmitted seamlessly and without interruption, allowing for real-time monitoring and analysis. Unreliable connectivity can result in lost or delayed data, which can significantly impact the effectiveness and quality of remote monitoring systems. We have solved that by using unbranded SIM cards that operate across: * 700+ vendors * 180+ countries in combination with an algorithm running on the Logger that periodically scans for the network with the best coverage. This means that if one vendor/network provider does not provide proper coverage or is temporarily out of service at the location of the datalogger, it will automatically detect it and select another network — and you don’t have to do anything. This greatly reduces the risk of insufficient connectivity. Furthermore, all cost for SIMs, data etc. is included in a Consibio Cloud subscription. ## Front panel and local interaction [Section titled “Front panel and local interaction”](#front-panel-and-local-interaction) The front panel carries a set of status LEDs and a single **Wake up** button. 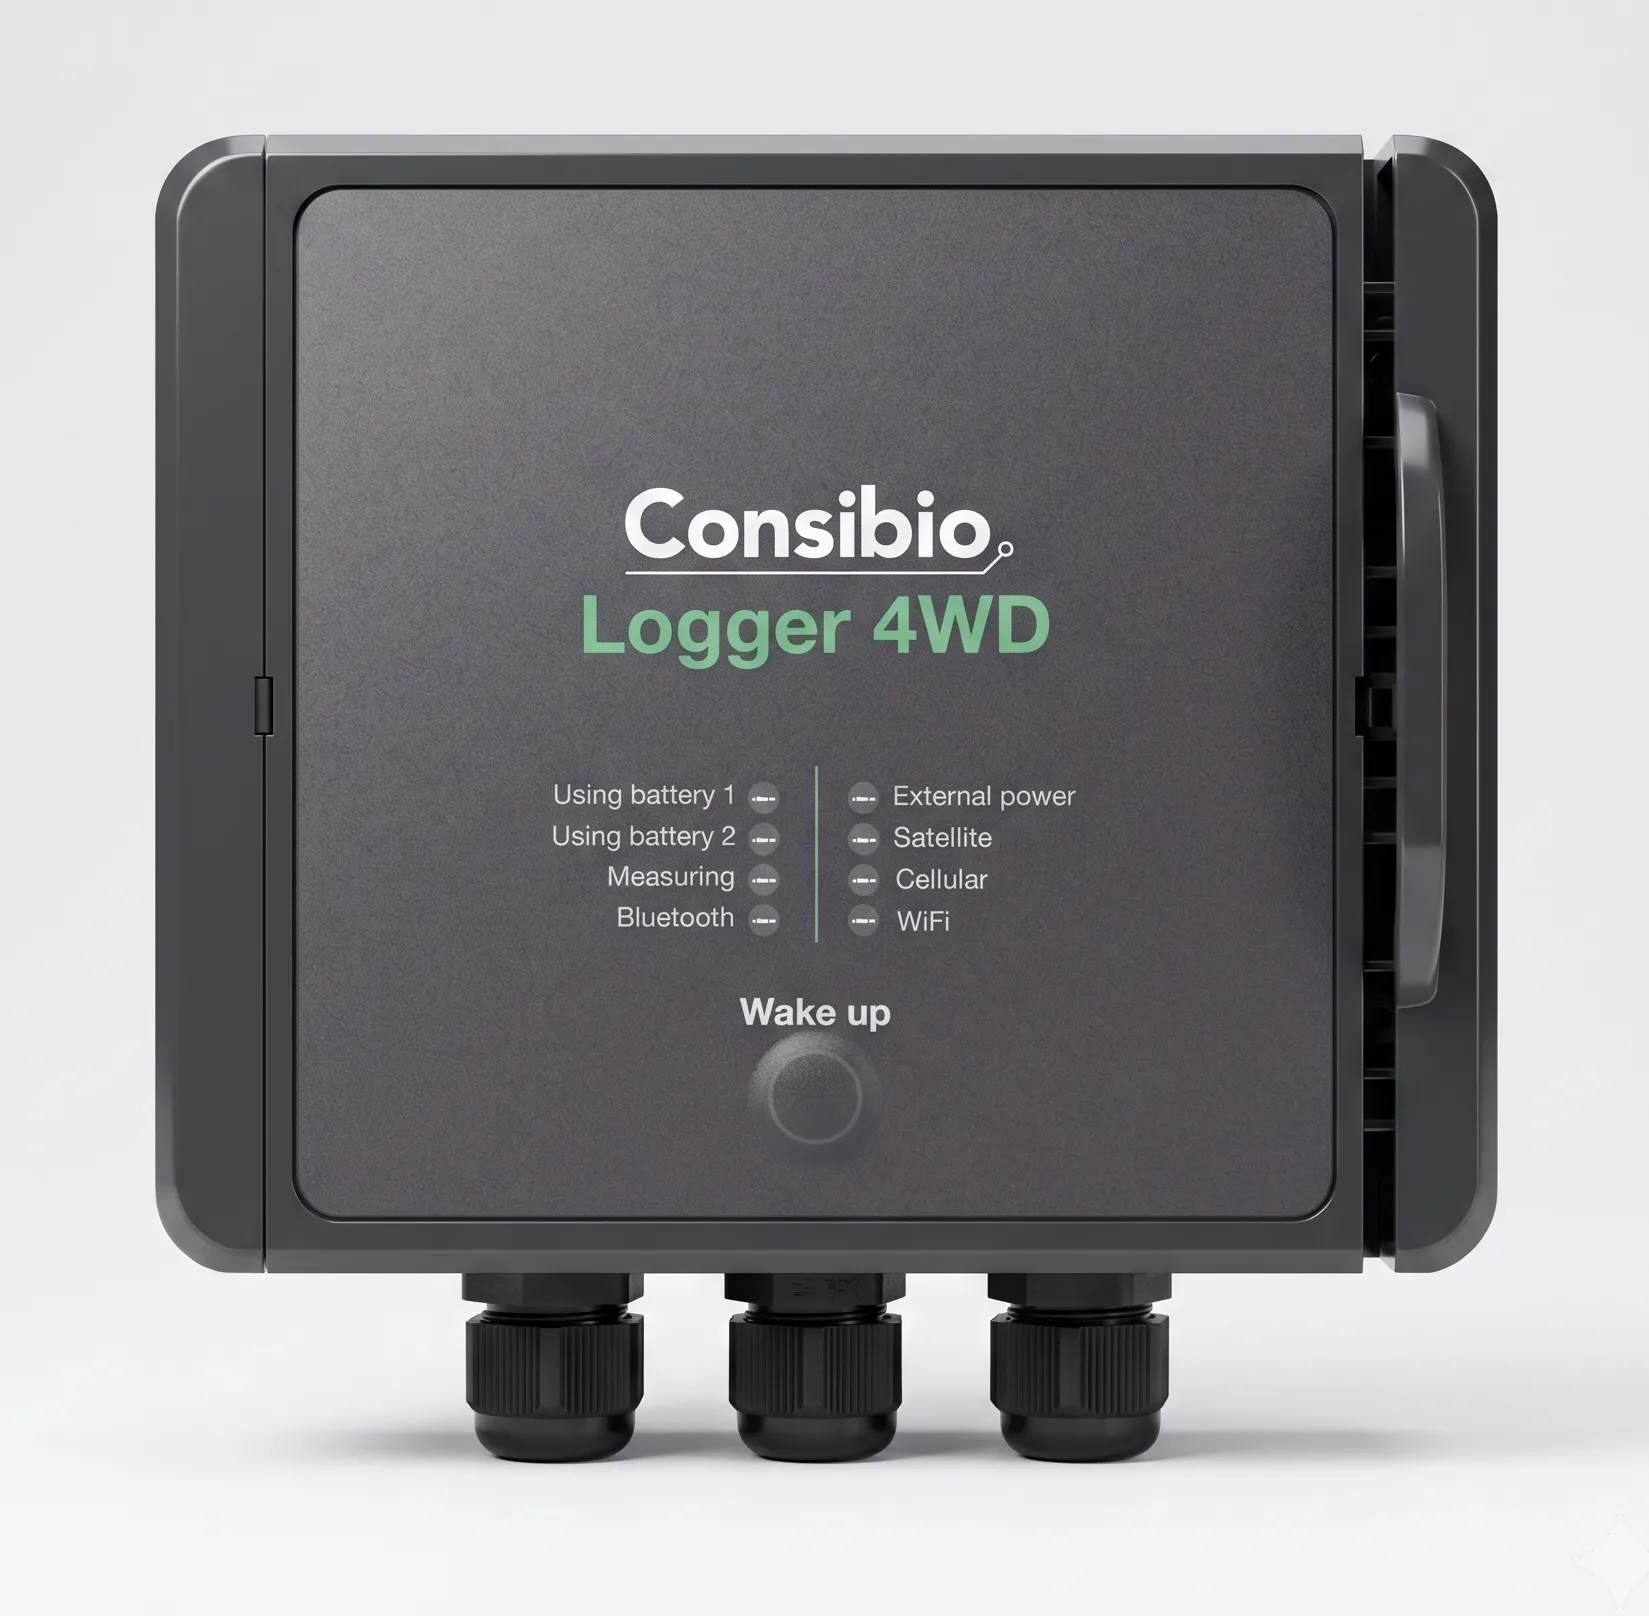 The LEDs give an at-a-glance overview of what the Logger is doing: | LED | Indicates | | --------------- | ---------------------------------------------------------- | | Using battery 1 | The Logger is currently drawing power from battery port 1. | | Using battery 2 | The Logger is currently drawing power from battery port 2. | | Measuring | A measurement is in progress. | | Bluetooth | Bluetooth is active for local configuration. | | External power | The Logger is running on external power. | | Satellite | Status of the optional satellite connection. | | Cellular | Status of the cellular connection. | | WiFi | Status of the WiFi connection. | The datalogger has a single **Wake up** button on the front panel. It can be used in two ways: 1. **Short click**: A short click on the button wakes up the device, it displays its current status on the LEDs and goes back to sleep. 2. **Press and hold**: Pressing and holding the button until all LEDs flash one by one, the device goes online and sends collected datapoints to the backend, after which it goes back to sleep. ## Mechanical [Section titled “Mechanical”](#mechanical) | Parameter | Value | | -------------------- | ------------------------------------------------------------------------------------- | | Operating conditions | –20°C to +50°C, 0–100% RH | | Dimensions | 151 x 125 x 60 mm (L x W x H) | | Housing material | Polycarbonate (UV and weather resistant); all components used are at least IP67-rated | ### Enclosure [Section titled “Enclosure”](#enclosure) The enclosure is made entirely of polycarbonate, making it UV and weather resistant. A hinged lid can be opened with a flat screwdriver and gives access to the electronics for maintenance, battery replacement or similar. ### Antenna [Section titled “Antenna”](#antenna) An internal, flexible antenna is mounted on the underside of the hinged lid, providing both antenna protection and good signal strength. On request, the datalogger can be delivered with an external IP67-rated antenna, which is recommended when the Logger is installed inside a metal enclosure. ## Electrical [Section titled “Electrical”](#electrical) ### Battery power options [Section titled “Battery power options”](#battery-power-options) Logger 4WD has two battery ports. When the battery on port 1 is depleted, the Logger seamlessly switches to battery 2 and uses this instead. The batteries are shipped with connectors that plug directly into the Logger, making them easily accessible and ensuring they can be swapped on-site within seconds without any tools. 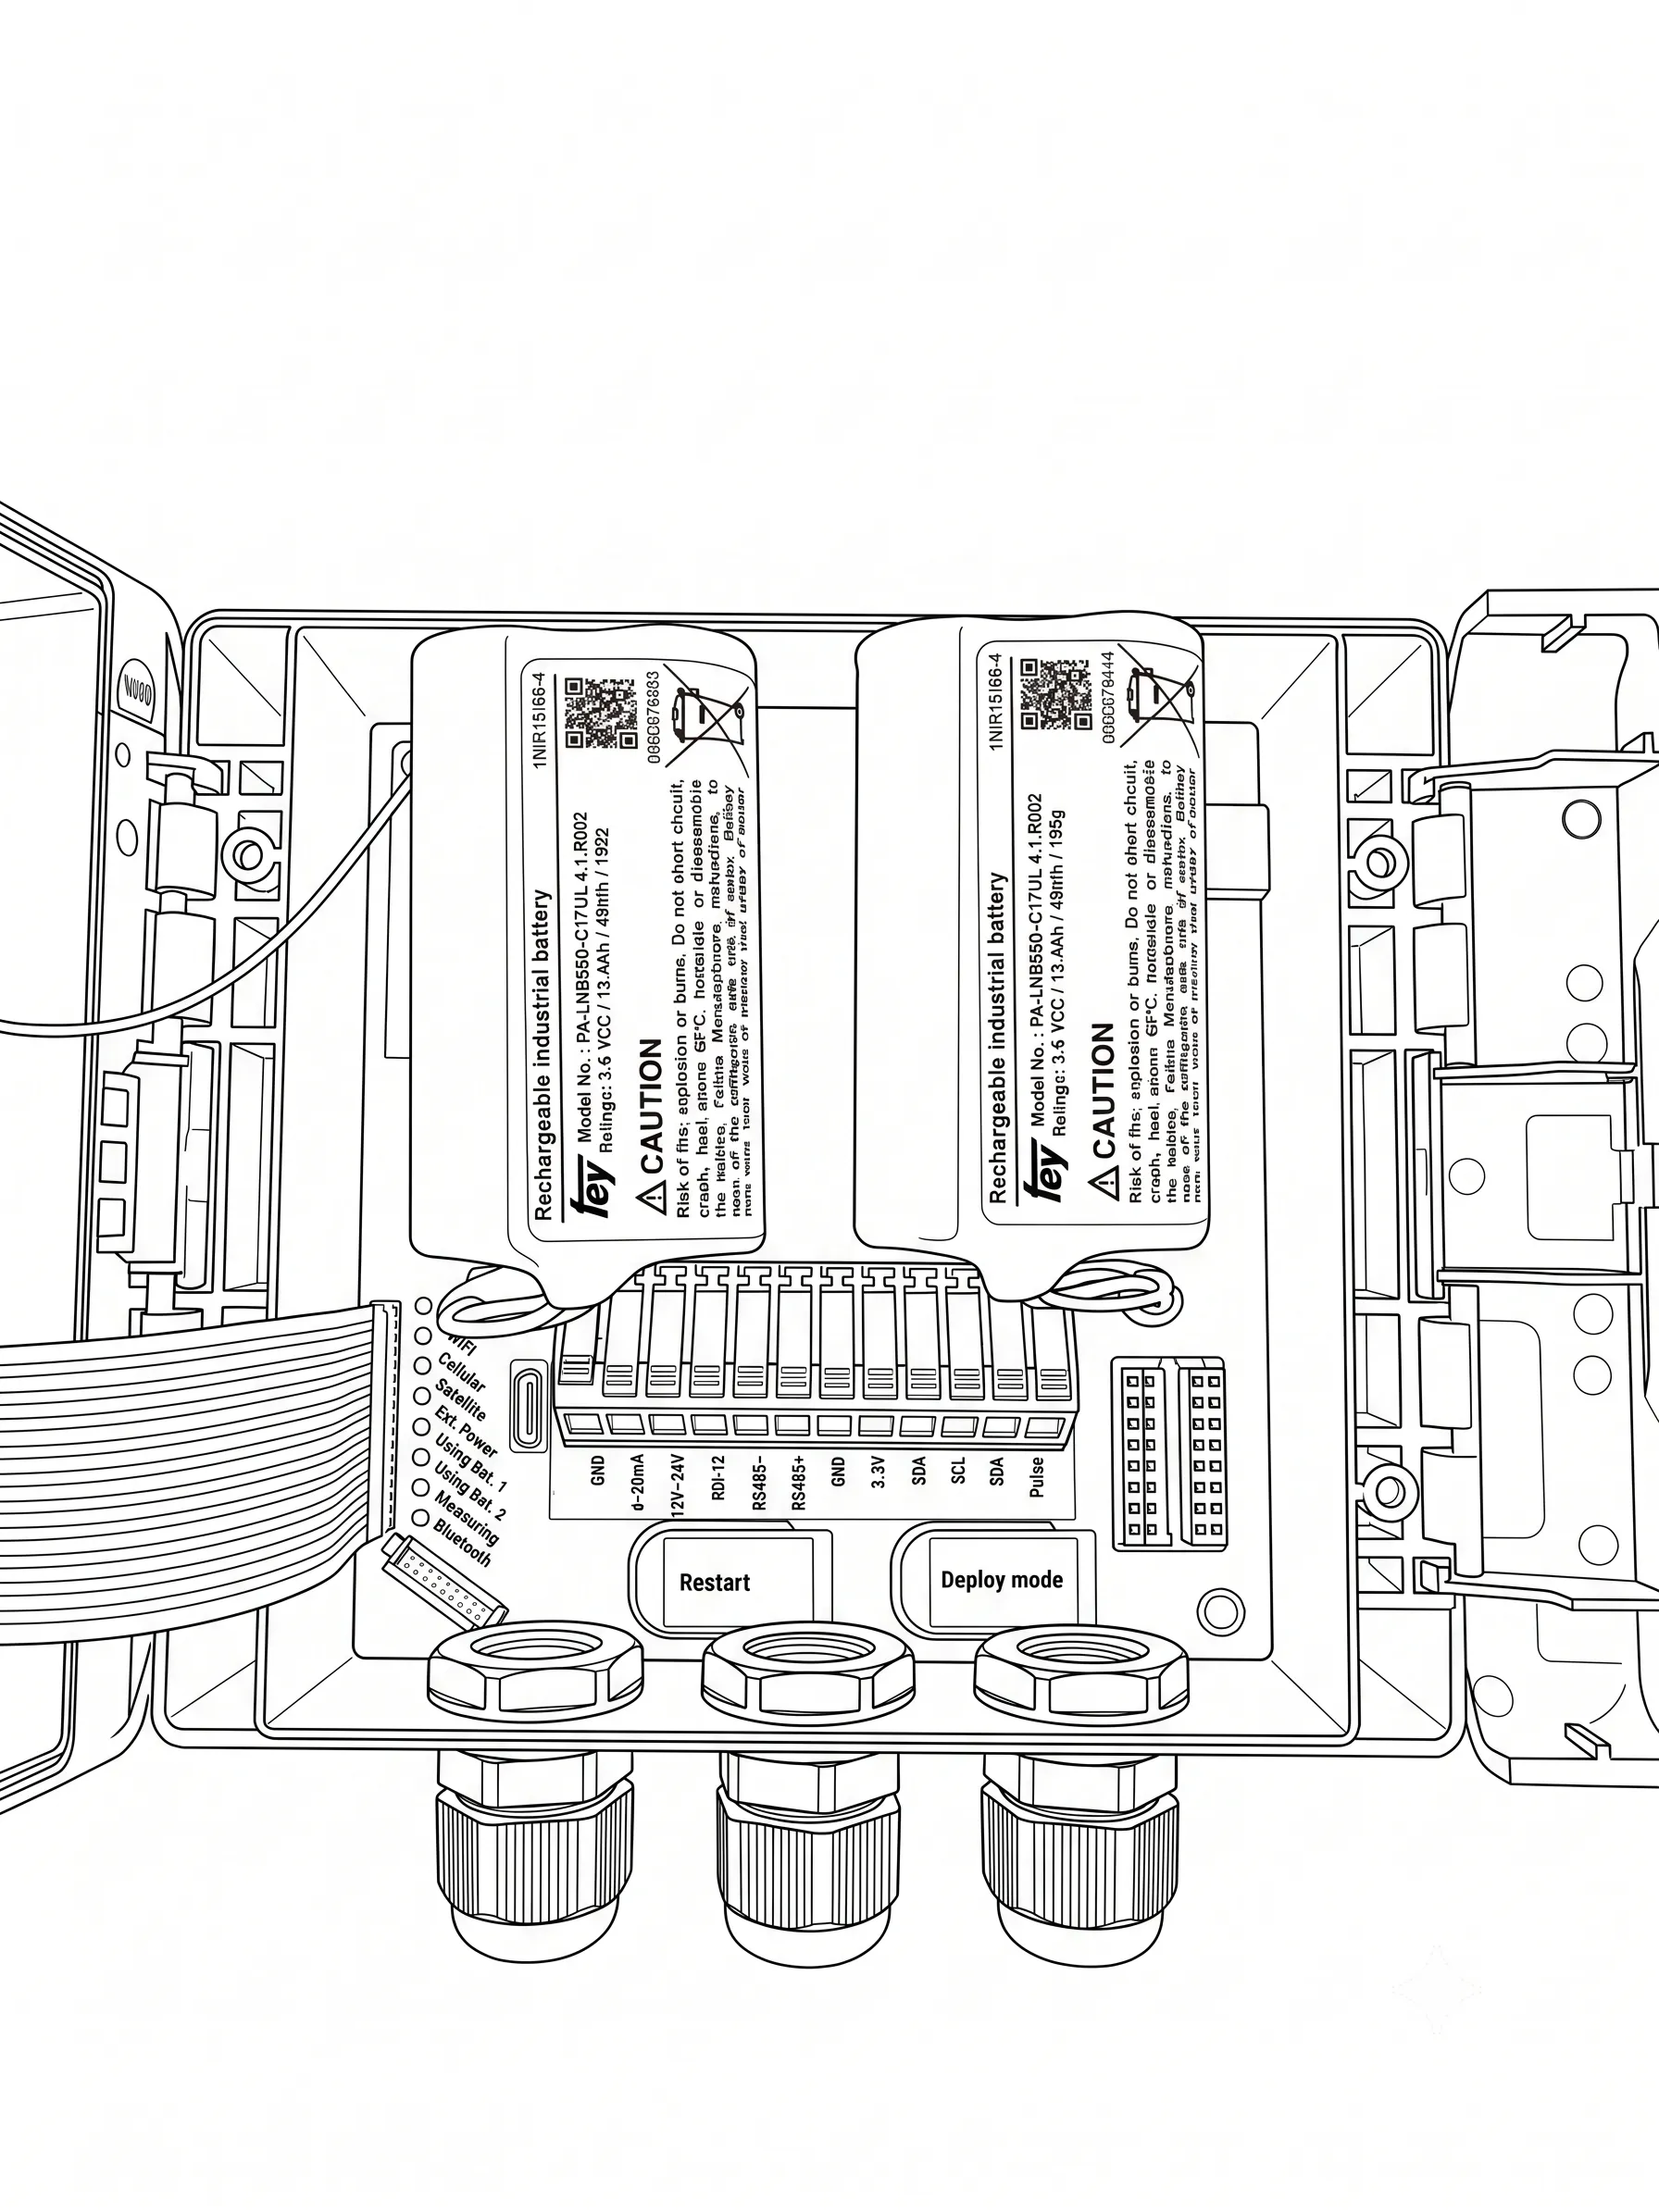 In the standard configuration, the Logger is shipped with two 48 Wh rechargeable Li-Ion batteries providing a very high battery capacity. An external **battery charger** is included with each Logger. #### Spare batteries avoid downtime [Section titled “Spare batteries avoid downtime”](#spare-batteries-avoid-downtime) If you have a set of spare batteries you can completely avoid downtime in the data collection by: 1. Charging the spare batteries at the office. 2. Going on-site and swapping the charged batteries with the existing ones. 3. Bringing the depleted batteries home and recharging them. See [Charging the batteries](/cloud/devices/charging-the-batteries/) for how to recharge a depleted battery pack. | Rechargeable Li-ion Battery | SKU: 112009 | | --------------------------- | ----------- | #### Extremely low self-discharge with Li-SOCl2 batteries [Section titled “Extremely low self-discharge with Li-SOCl2 batteries”](#extremely-low-self-discharge-with-li-socl2-batteries) If the Loggers are used in a setup where you only need to measure and transmit very infrequently (e.g. once a day), you can achieve +5 years of battery life if the rechargeable Li-Ion batteries are replaced with non-rechargeable Li-SOCl2 batteries. This is a different battery chemistry that has a much lower **self-discharge**, enabling them to function for many years where only a small amount of power is drawn. They cannot be recharged and must be replaced when depleted. The LSH-20 Backup Battery is a 46 Wh Li-SOCl2 battery compatible with Logger 4WD with the same connector used for the rechargeable battery pack. The LSH-20 Backup Battery can also be used in combination with a rechargeable battery to enable a setup with a rechargeable battery used as the primary power supply and the LSH-20 battery as a “backup” that doesn’t deplete itself unless used by the Logger. | LSH-20 Backup Battery | SKU: 112004 | | --------------------- | ----------- | ### Installing a solar panel [Section titled “Installing a solar panel”](#installing-a-solar-panel) A solar panel can be connected to Logger 4WD to keep it powered from the sun. The panel’s cable is led into the enclosure through a cable gland and terminates in an **angled USB-C connector** that plugs into the Logger. The angled connector needs room beside the USB-C port, so the **left battery must be removed** and the connector directed towards the now empty battery slot. The Logger runs on the remaining battery, which the solar panel keeps charged — see [Charging the batteries](/cloud/devices/charging-the-batteries/). 1. Open the hinged lid and **remove the left battery**. 2. **Mount the solar panel cable in the gland** on the first mounting point. 3. **Attach the angled USB-C connector to the cable.** 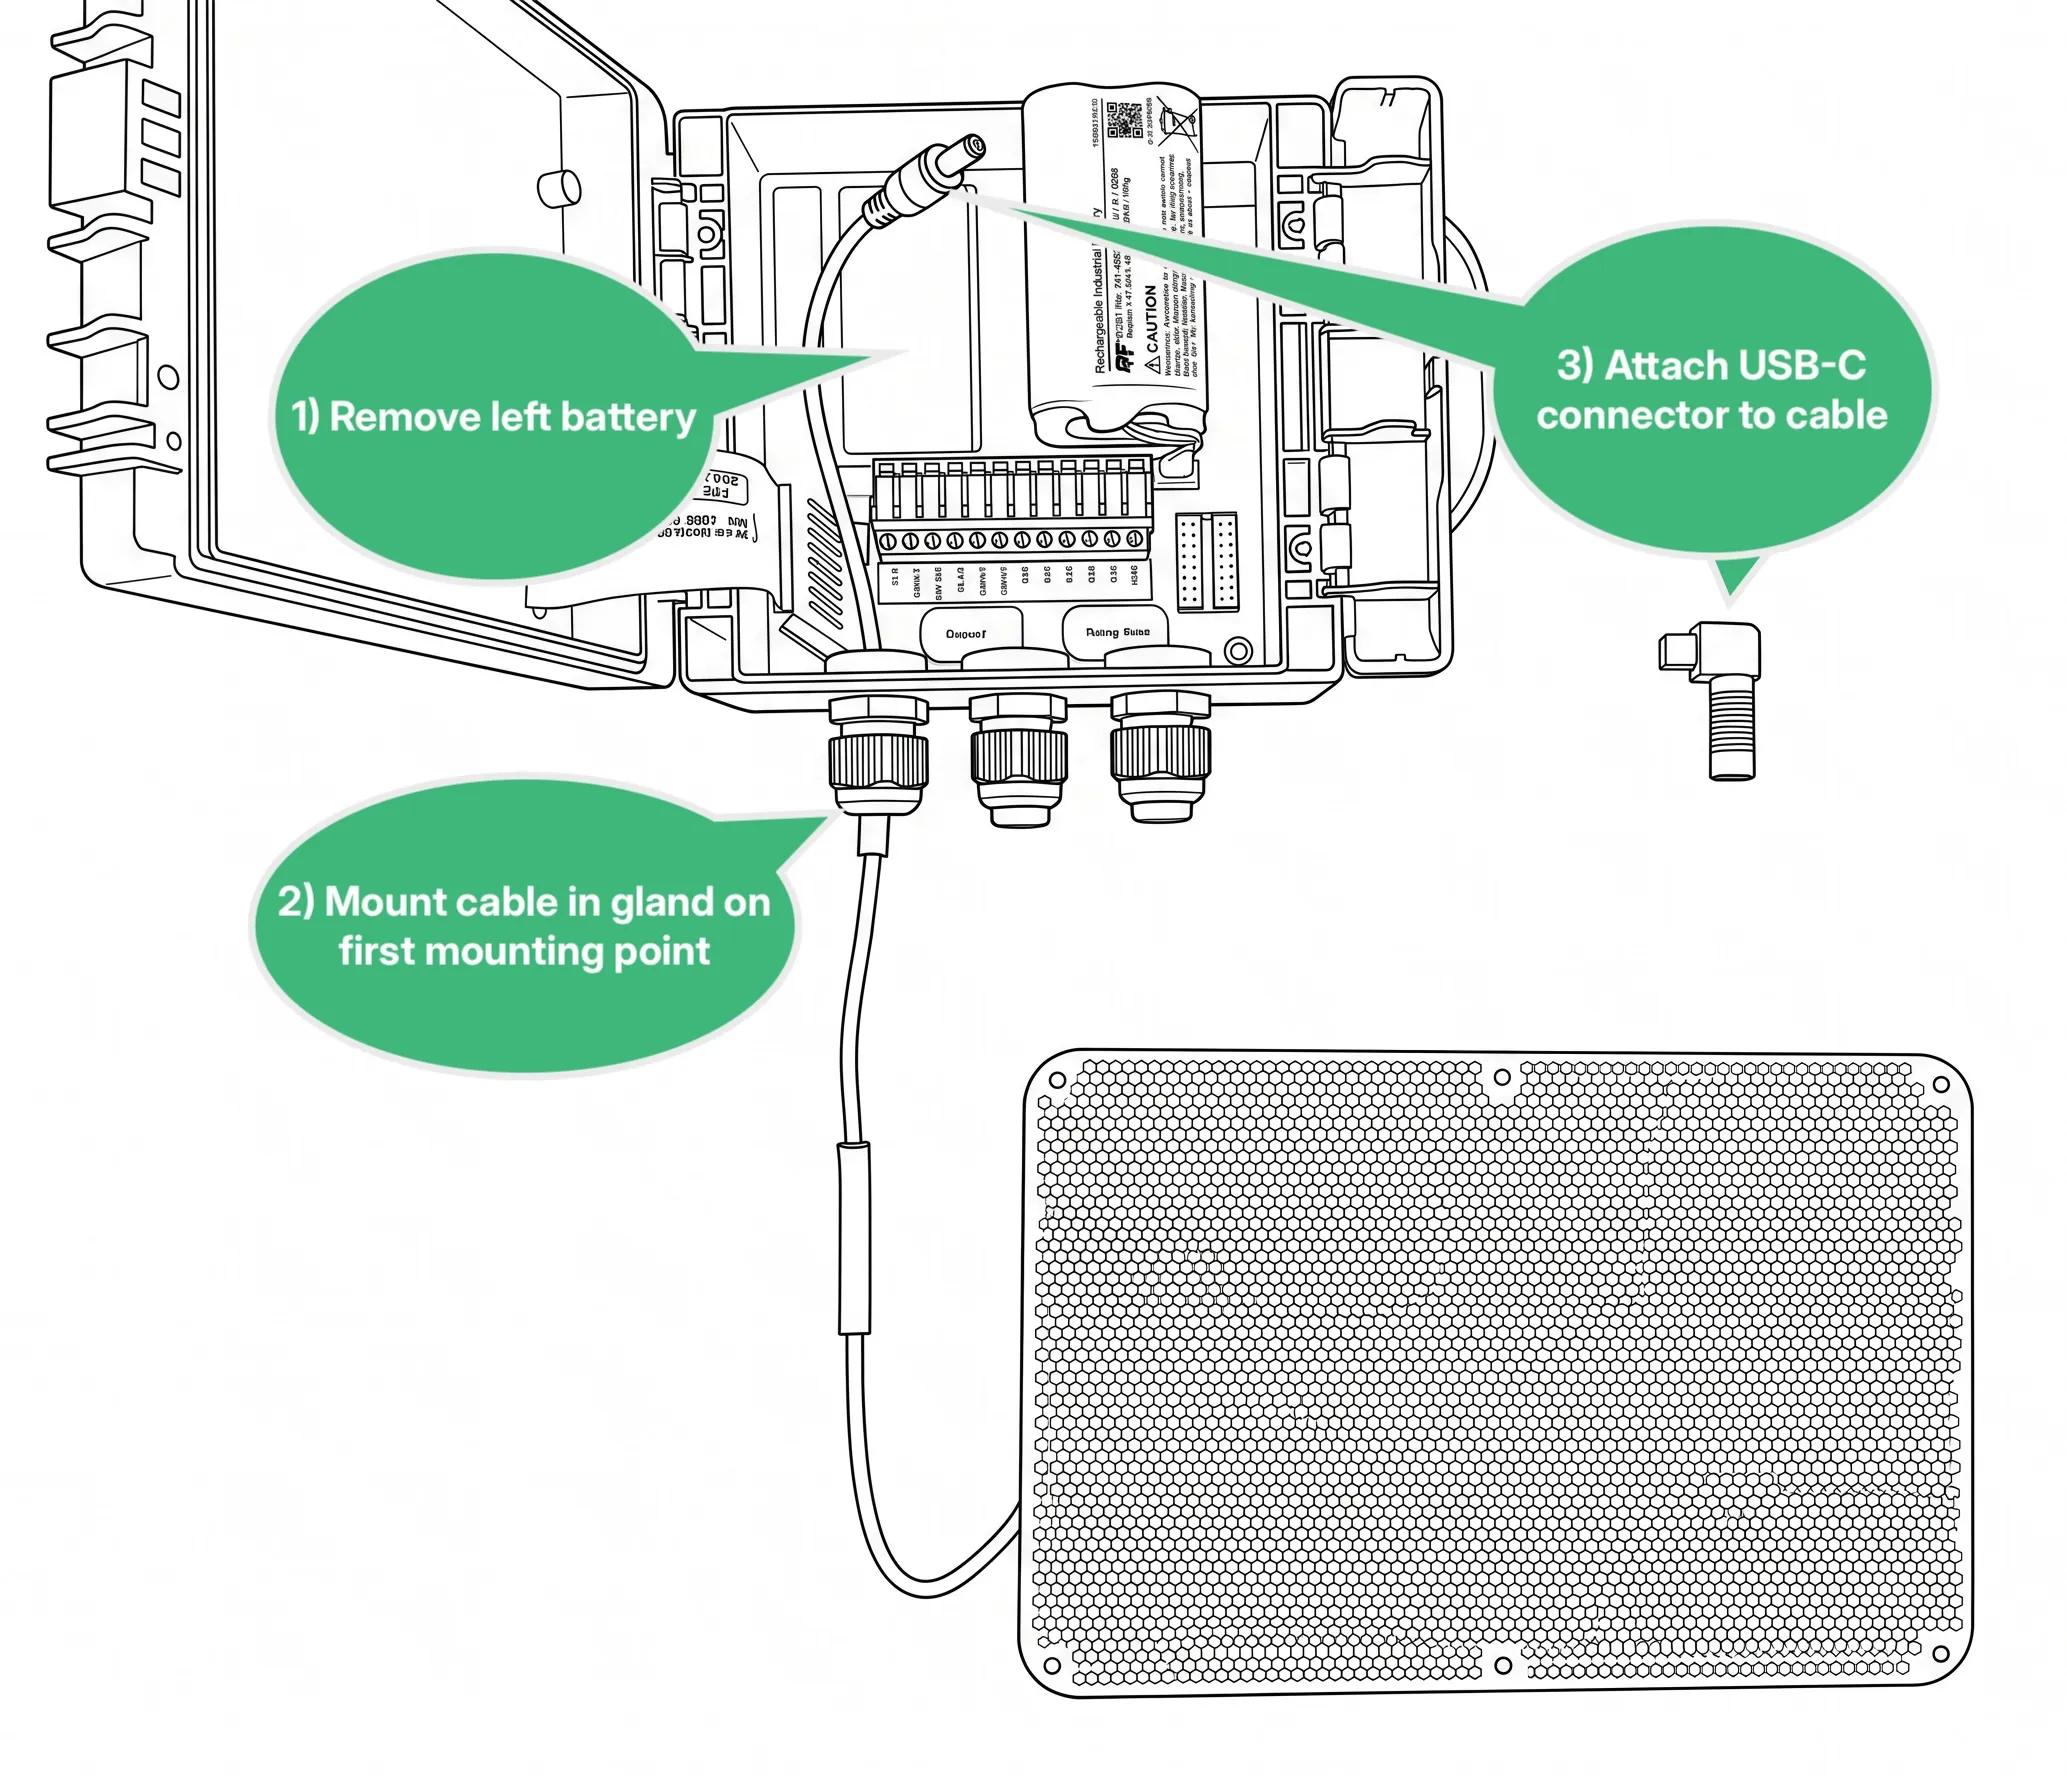 4. **Attach the USB-C connector to the Logger**, with the angle directed towards the now empty battery slot. 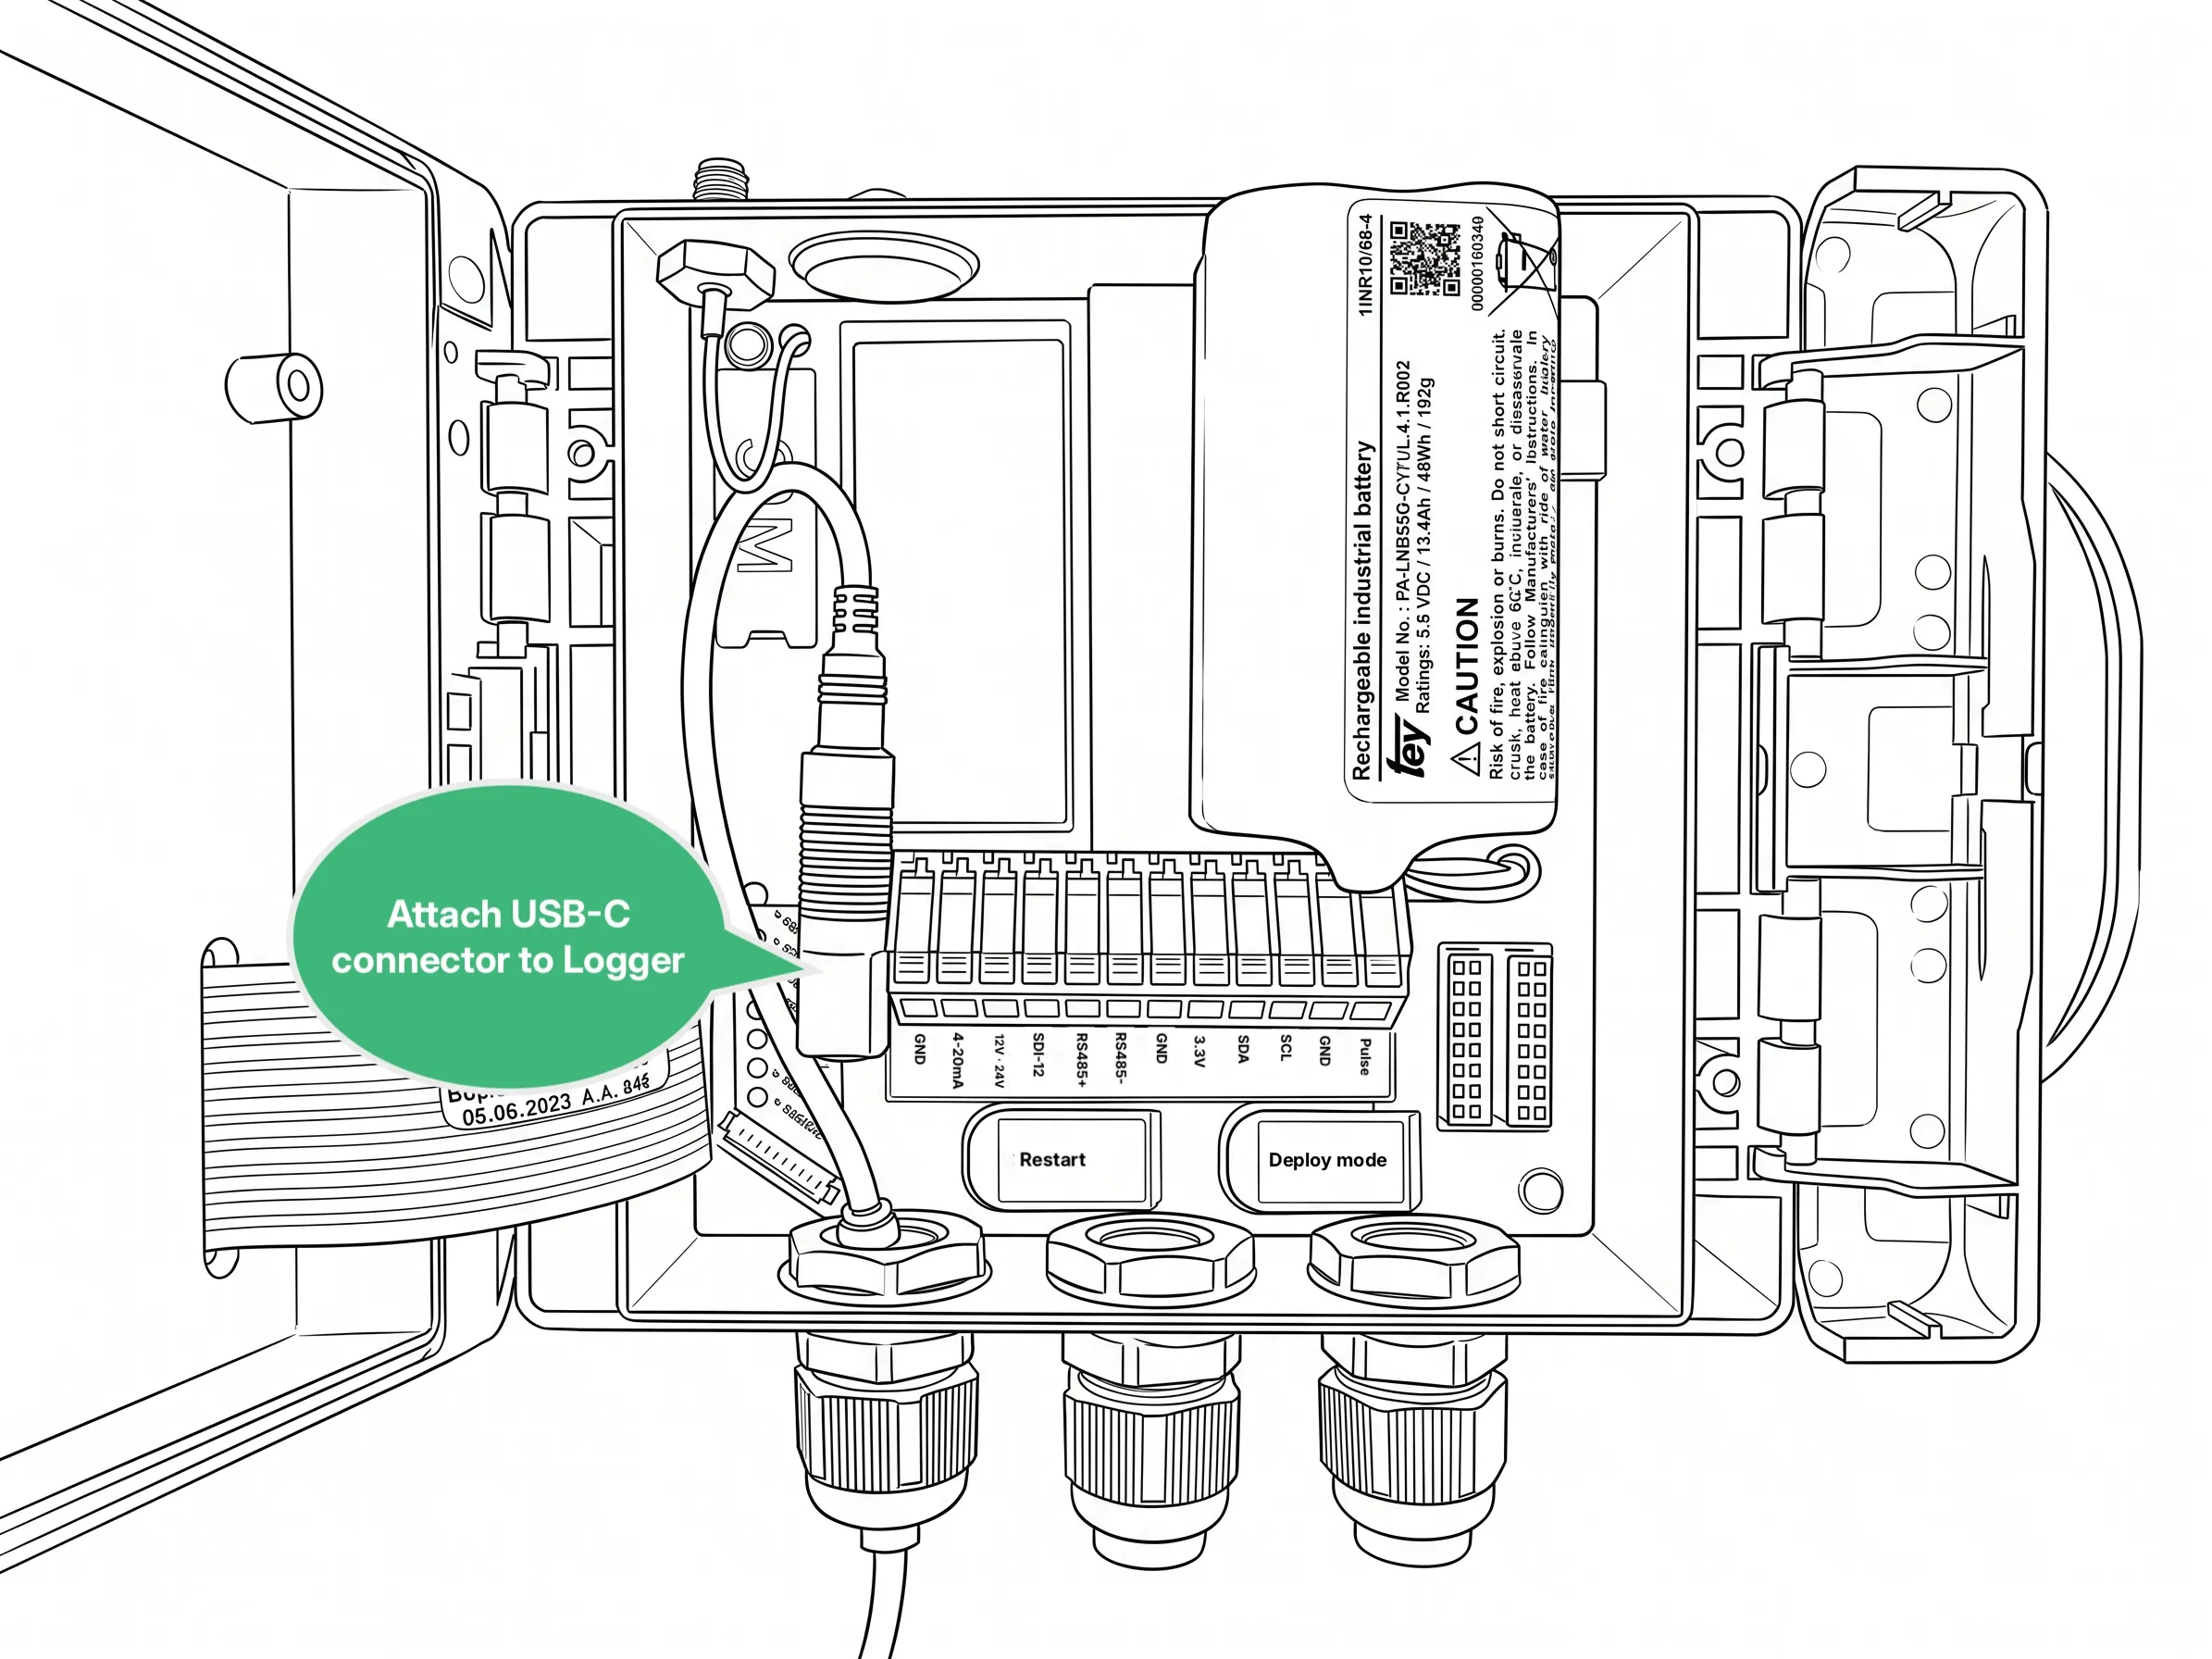 Using the **USB adapter cable** is the same setup: remove the left battery, mount the cable in the gland and attach the angled USB-C connector to the Logger, directed towards the empty battery slot. ### I/O and sensor connections [Section titled “I/O and sensor connections”](#io-and-sensor-connections) Logger 4WD supports all the most common interfacing options and protocols. | I/O | Description | | --------------------------- | -------------------------------------------------------------------------------------------------------------------------------------------------------------------------------------------------------------------------------------------------------------------------------------------------------- | | ModbusRTU / RS485 | ModbusRTU over RS485. Can be used with any ModbusRTU sensor. Multiple sensors can be connected to the same port if they have different addresses. | | SDI-12 | Connect to SDI-12 compatible sensors. Multiple sensors can be connected to the same port if they have different addresses. | | 4-20mA | Sample a 4-20mA signal from an analog sensor. In a two-wire setup, connect 12V to sensor **(+)** and connect the return path **(-)** to the 4-20mA input. | | Pulse counter / Wake signal | Count pulses from relays, float switches, rain gauges, NPN sensors etc. This is a **dry signal** input that measures if a connection between this terminal and **GND** is closed or open. Can also be used to wake the Logger from deep sleep and perform a measurement outside the configured schedule. | | 3.3V power output | 3.3V voltage output to power low-power sensors and peripherals. **Max current:** 500 mA | | 12V/24V power output | Standard power output to power sensors and peripherals. It can be configured to either 12V or 24V depending on the configuration in the cloud **Max current:** 12V: 150 mA 24V: 75mA | The Logger has 3 parallel ports, which all contain the input/output options listed above. This means that the Logger can support up to three parallel connections of the same type without signal conflicts. This can be used to connect e.g. three 4-20mA analog sensors, three ModbusRTU devices with the same address or similar. 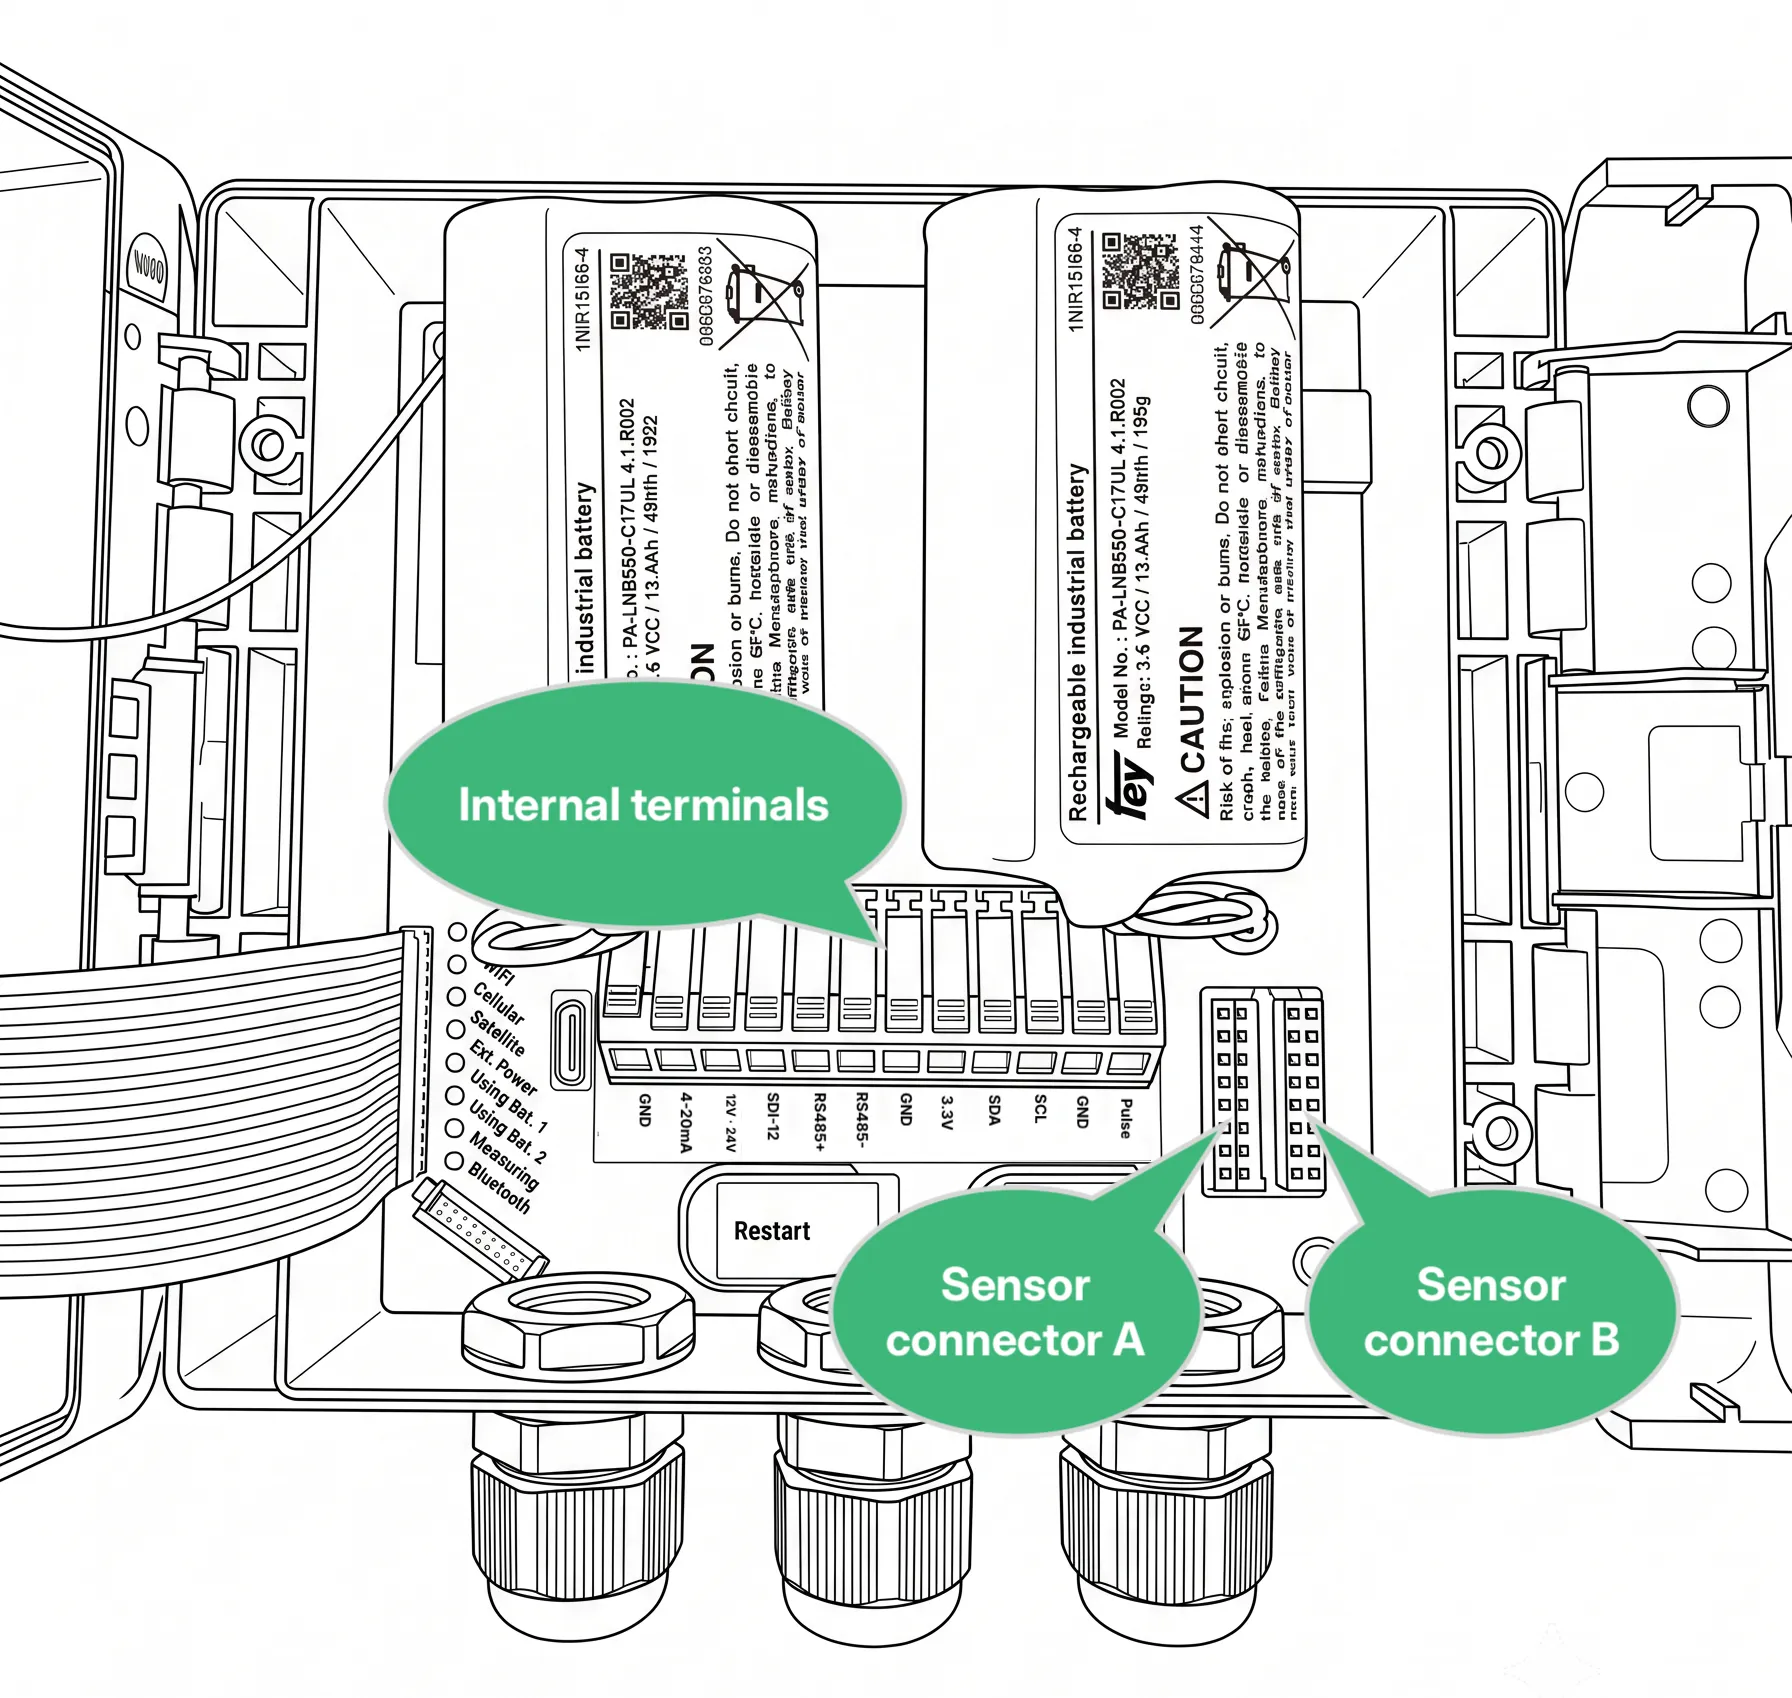 Furthermore, the integrated terminals can be used to easily connect custom sensors without a connector. Logger 4WD is **sensor-agnostic** and can be used with any compatible sensor you might already own. #### Using Sensor Connector A and B [Section titled “Using Sensor Connector A and B”](#using-sensor-connector-a-and-b) Sensor connector A and B are spring-loaded push-in connectors, that allows you to connect a pre-crimped wire by simply pushing it into the connection. See below for pin assignments in the two connectors. 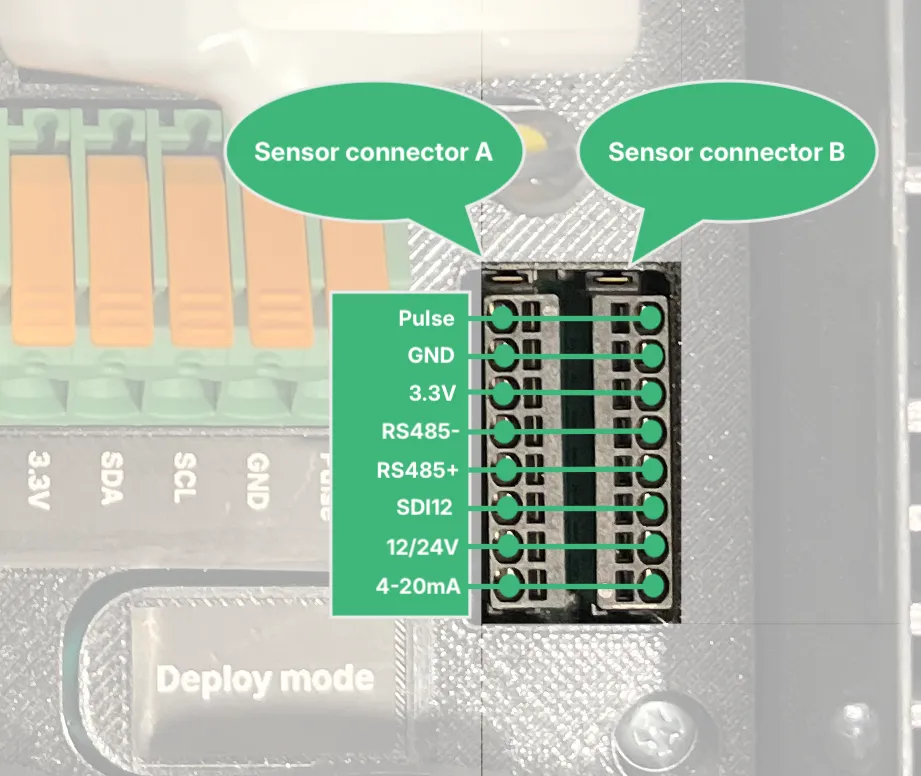 We advise that the wires used in these connectors are crimped with a ferrule [like this one from Phoenix Contact AI 0,14- 6 GY](https://www.phoenixcontact.com/en-pc/products/ferrule-ai-014-6-gy-1000-1034128). After crimping, the wire can be inserted into the circular holes (marked with green above). To unload a connected wire, insert a small flathead screwdriver in the rectangular hole in the connector to disengage the internal spring load and pull out the wire. Disclaimer Using the spring-loaded sensor connector A and B requires careful handling - especially when unloading a connected wire. The connector can be damaged if excessive force is used. Using these connectors happens at your own risk and damage to it is not covered by the standard warranty on the device. ### Internal measurements [Section titled “Internal measurements”](#internal-measurements) The datalogger monitors several parameters internally, which are automatically reported to Consibio Cloud. | Parameter | Description | | ------------------------ | ------------------------------------------------------------------------------------------------------------------------------------------------------------------------------------------------------------------------------------------------------------------------------------------------------------------------------------------------------------------------------------------------------------------------------------------------------------------------------------------------------------ | | Temperature and humidity | Logger 4WD has a built-in temperature and humidity sensor. This makes it possible to remotely monitor that the internal electronics are not exposed to conditions outside the recommended ranges. The humidity sensor also ensures that risk of condensation can be registered and alerted to the backend before the electronics are affected, to ease the troubleshooting process. **Temperature sensor:** Range –40° to +125°C, Accuracy 0.2°C. **Humidity sensor:** Range 0 to 100% RH, Accuracy 1.8% RH. | | Barometric pressure | The internal barometric pressure of the Logger is continuously measured. A pressure relief valve inside the enclosure ensures that the pressure inside the Logger is the same as the surroundings. This can be used to measure barometric pressure directly (for weather monitoring), but can also be used for automated pressure compensation of absolute pressure transducers. **Sensor:** Range 300 to 1250 mbar, Accuracy 0.5 mbar (worst-case). | | Tilt and orientation | An internal accelerometer ensures that the Logger is always aware of its own orientation in 3D space. Thus, the Logger itself can be used as an **inclinometer**. It can also be used to generate automated alerts if the Logger is mounted on a structure that might be knocked over in traffic or similar. | | Battery gauging | The Logger continuously monitors the actual state of charge of both the rechargeable battery and backup battery. This is used to monitor battery state from the backend and generate alerts when it is almost depleted, but also to alter operation to prioritize power over performance in situations where it is needed. | ### Power consumption and battery lifetime [Section titled “Power consumption and battery lifetime”](#power-consumption-and-battery-lifetime) The Logger has 3 operational states, which have very different power consumptions: | State | Description | Power consumption (typical) | | ------------ | ---------------------------------------------------------------------------------------------------------------------------------------------------------------------------------------------------------------------------- | --------------------------- | | Deep sleep | When the Logger is not actively performing a measurement or transmitting data, it goes to deep sleep to preserve power. In most configurations, it spends most of its time in deep sleep. | 0.2 mW | | Measurement | The Logger periodically wakes up to perform a measurement, save the result in its internal flash storage and then go back to sleep. The power consumption during measurement depends a lot on the type of sensors connected. | 150 to 500 mW | | Transmission | Transmission is by far the largest power consumer, and thus often dictates the battery lifetime. | 1600 mW | The user can configure the **measurement interval** and the **transmission interval** for each Logger through Consibio Cloud. These settings dictate how much time the Logger spends in each state and thus the effective battery life. Because Logger 4WD uses the same electronics and battery packs as the [Logger WD-68](/cloud/devices/logger-wd-68/), the battery-lifetime estimates and discharge curves shown for that model apply here as well. The transmission power and time depend highly on the quality of the cellular connection and can thus vary significantly if connectivity is very poor.
# Logger WD-68
> Specifications and capabilities of the Logger WD-68 battery-driven cellular datalogger — connectivity, mechanical design, power options and I/O.
Logger WD-68 is a battery-driven cellular datalogger for remote monitoring. It is sensor-agnostic and supports the most common industrial interfaces, so it can be used with any compatible sensor you might already own. [Download the datasheet as PDF](https://drive.google.com/file/d/1KTZTdLDL3mossnRqKIL306esSoQF9yvM/view?usp=sharing) 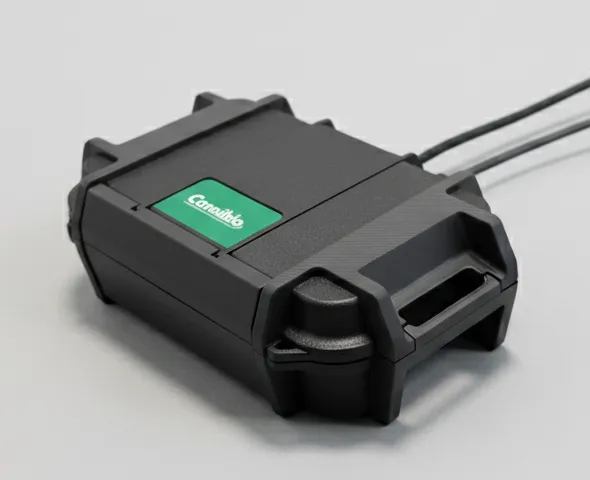 ## Specifications [Section titled “Specifications”](#specifications) ### Overall [Section titled “Overall”](#overall) | Parameter | Value | | ----------------- | -------------------------------------------------------------------------------------------------------------------------------------------- | | Expected lifetime | +10 years | | Guarantee | 1 year | | Connectivity | **Cellular:** LTE Cat-M1, NB-IoT (eSIM included; a custom nanoSIM can be inserted). **WiFi:** 2.4 GHz (802.11 b/g/n). **Add-on:** Satellite. | | Standards | DS/EN 61326-1:2013 | ## Cellular [Section titled “Cellular”](#cellular) One of the most crucial parts of remote monitoring is robust connectivity, because it ensures that data is transmitted seamlessly and without interruption, allowing for real-time monitoring and analysis. Unreliable connectivity can result in lost or delayed data, which can significantly impact the effectiveness and quality of remote monitoring systems. We have solved that by using unbranded SIM cards that operate across: * 700+ vendors * 180+ countries in combination with an algorithm running on the Logger that periodically scans for the network with the best coverage. This means that if one vendor/network provider does not provide proper coverage or is temporarily out of service at the location of the datalogger, it will automatically detect it and select another network — and you don’t have to do anything. This greatly reduces the risk of insufficient connectivity. Furthermore, all cost for SIMs, data etc. is included in a Consibio Cloud subscription. ## Mechanical [Section titled “Mechanical”](#mechanical) | Parameter | Value | | ------------------ | ------------------------------------------------------------------------------------------------------------------------------------------ | | Material | Outer shell constructed from abrasion- and impact-proof ABS; bumpers in shock-resistant TPU; carabiners in A4 marine-grade stainless steel | | Dimensions (outer) | 250 x 155 x 73 mm (9.84“ x 6.12“ x 2.89“) | ### Mounting [Section titled “Mounting”](#mounting) The preferred mounting method is via an eyebolt where Logger WD-68 is snapped on using the included carabiners. 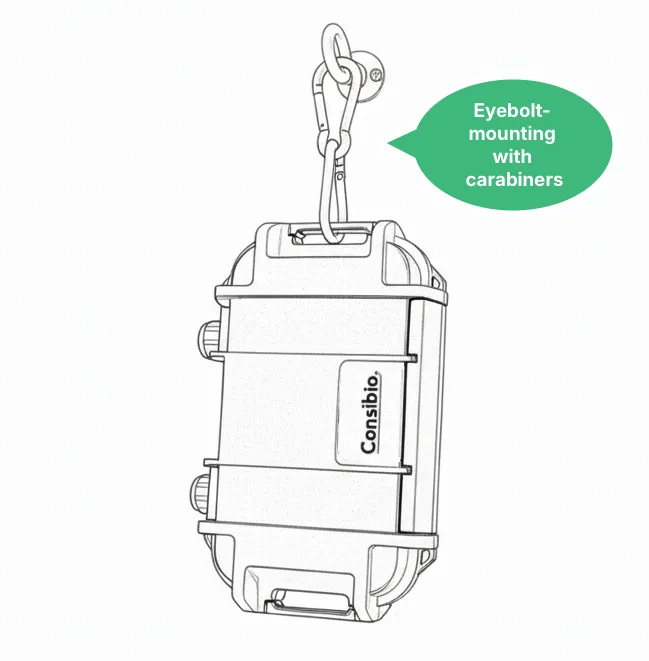 ## Electrical [Section titled “Electrical”](#electrical) ### Battery power options [Section titled “Battery power options”](#battery-power-options) Logger WD-68 has two battery ports. When the battery on port 1 is depleted, the Logger will seamlessly switch to battery 2 and use this instead. The batteries are shipped with connectors that plug directly into the Logger, making them easily accessible and ensuring they can be swapped on-site within seconds without any tools. 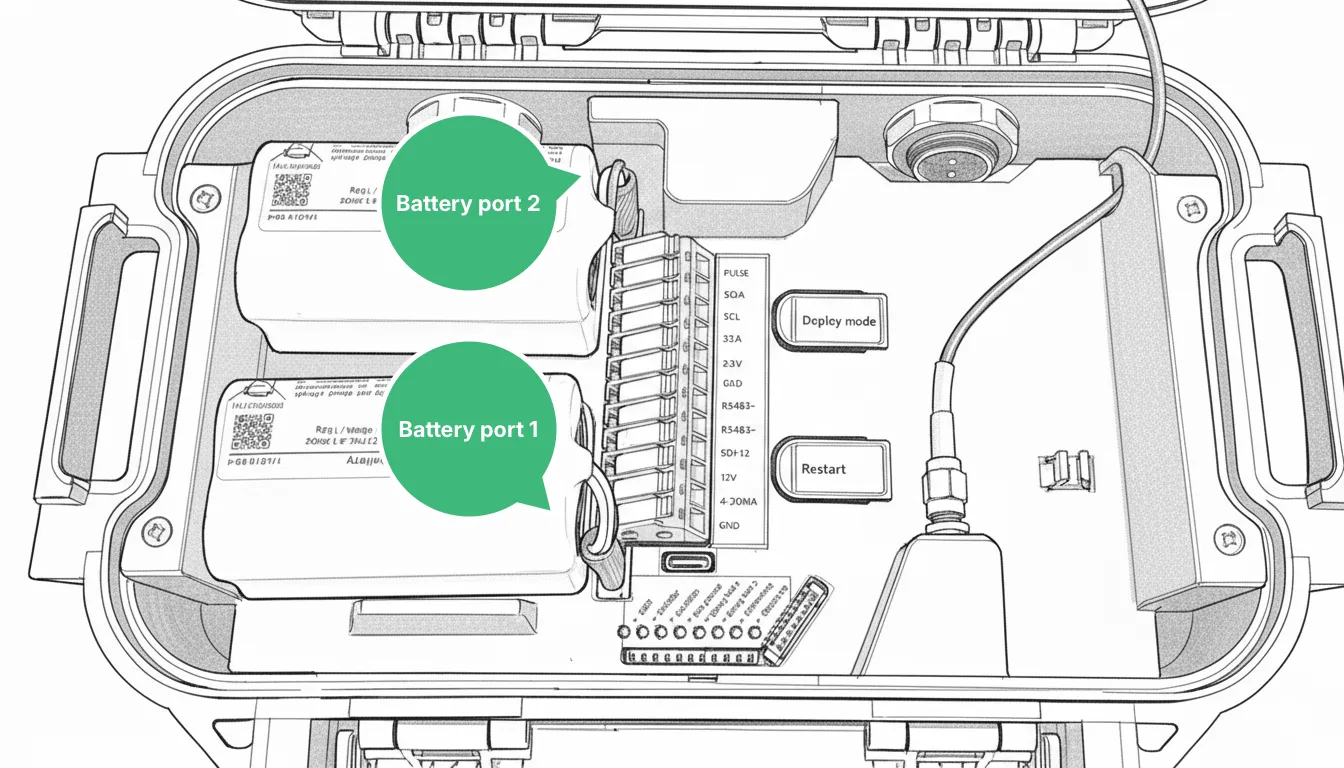 In the standard configuration, the Logger is shipped with two 48 Wh rechargeable Li-Ion batteries providing a very high battery capacity. An external **battery charger** is included with each Logger. #### Spare batteries avoid downtime [Section titled “Spare batteries avoid downtime”](#spare-batteries-avoid-downtime) If you have a set of spare batteries you can completely avoid downtime in the data collection by: 1. Charging the spare batteries at the office. 2. Going on-site and swapping the charged batteries with the existing ones. 3. Bringing the depleted batteries home and recharging them. | Rechargeable Li-ion Battery | SKU: 112009 | | --------------------------- | ----------- | #### Extremely low self-discharge with Li-SOCl2 batteries [Section titled “Extremely low self-discharge with Li-SOCl2 batteries”](#extremely-low-self-discharge-with-li-socl2-batteries) If the Loggers are used in a setup where you only need to measure and transmit very infrequently (e.g. once a day), you can achieve +5 years of battery life if the rechargeable Li-Ion batteries are replaced with non-rechargeable Li-SOCl2 batteries. This is a different battery chemistry that has a much lower **self-discharge**, enabling them to function for many years where only a small amount of power is drawn. They cannot be recharged and must be replaced when depleted. The LSH-20 Backup Battery is a 46 Wh Li-SOCl2 battery compatible with Logger WD-68 with the same connector used for the rechargeable battery pack. The LSH-20 Backup Battery can also be used in combination with a rechargeable battery to enable a setup with a rechargeable battery used as the primary power supply and the LSH-20 battery as a “backup” that doesn’t deplete itself unless used by the Logger. | LSH-20 Backup Battery | SKU: 112004 | | --------------------- | ----------- | ### I/O and sensor connections [Section titled “I/O and sensor connections”](#io-and-sensor-connections) Logger WD-68 supports all the most common interfacing options and protocols. | I/O | Description | | --------------------------- | -------------------------------------------------------------------------------------------------------------------------------------------------------------------------------------------------------------------------------------------------------------------------------------------------------- | | ModbusRTU / RS485 | ModbusRTU over RS485. Can be used with any ModbusRTU sensor. Multiple sensors can be connected to the same port if they have different addresses. | | SDI-12 | Connect to SDI-12 compatible sensors. Multiple sensors can be connected to the same port if they have different addresses. | | 4-20mA | Sample a 4-20mA signal from an analog sensor. In a two-wire setup, connect 12V to sensor **(+)** and connect the return path **(-)** to the 4-20mA input. | | Pulse counter / Wake signal | Count pulses from relays, float switches, rain gauges, NPN sensors etc. This is a **dry signal** input that measures if a connection between this terminal and **GND** is closed or open. Can also be used to wake the Logger from deep sleep and perform a measurement outside the configured schedule. | | 3.3V power output | 3.3V voltage output to power low-power sensors and peripherals. **Max current:** 500 mA | | 12V power output | Standard 12V voltage output to power sensors and peripherals. **Max current:** 200 mA | The Logger has 3 parallel ports, which all contain the input/output options listed above. 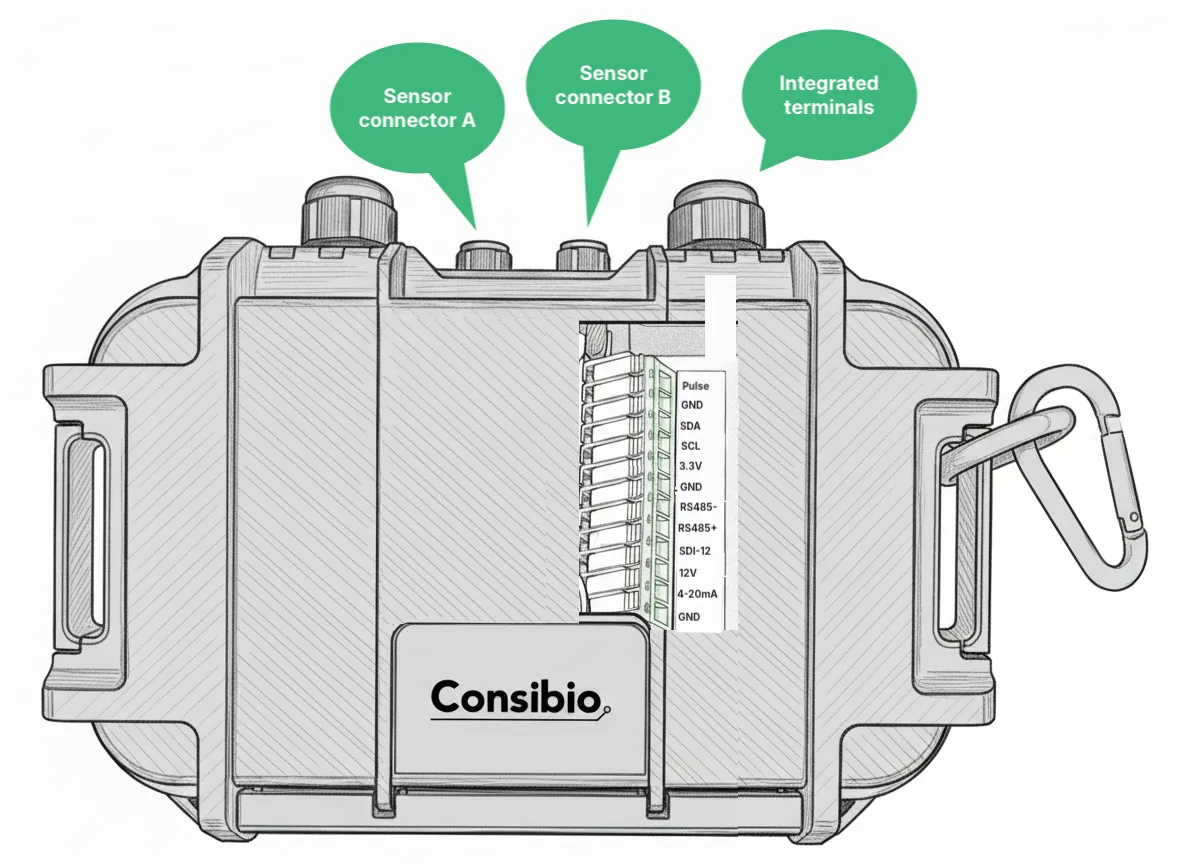 This means that the Logger can support up to three parallel connections of the same type without signal conflicts. This can be used to connect e.g. three 4-20mA analog sensors, three ModbusRTU devices with the same address or similar. Furthermore, the integrated terminals can be used to easily connect custom sensors without a connector. Logger WD-68 is **sensor-agnostic** and can be used with any compatible sensor you might already own. ### Internal measurements [Section titled “Internal measurements”](#internal-measurements) The datalogger monitors several parameters internally, which are automatically reported to Consibio Cloud. | Parameter | Description | | ------------------------ | -------------------------------------------------------------------------------------------------------------------------------------------------------------------------------------------------------------------------------------------------------------------------------------------------------------------------------------------------------------------------------------------------------------------------------------------------------------------------------------------------------------- | | Temperature and humidity | Logger WD-68 has a built-in temperature and humidity sensor. This makes it possible to remotely monitor that the internal electronics are not exposed to conditions outside the recommended ranges. The humidity sensor also ensures that risk of condensation can be registered and alerted to the backend before the electronics are affected, to ease the troubleshooting process. **Temperature sensor:** Range –40° to +125°C, Accuracy 0.2°C. **Humidity sensor:** Range 0 to 100% RH, Accuracy 1.8% RH. | | Barometric pressure | The internal barometric pressure of the Logger is continuously measured. A pressure relief valve inside the enclosure ensures that the pressure inside the Logger is the same as the surroundings. This can be used to measure barometric pressure directly (for weather monitoring), but can also be used for automated pressure compensation of absolute pressure transducers. **Sensor:** Range 300 to 1250 mbar, Accuracy 0.5 mbar (worst-case). | | Tilt and orientation | An internal accelerometer ensures that the Logger is always aware of its own orientation in 3D space. Thus, the Logger itself can be used as an **inclinometer**. It can also be used to generate automated alerts if the Logger is mounted on a structure that might be knocked over in traffic or similar. | | Battery gauging | The Logger continuously monitors the actual state of charge of both the rechargeable battery and backup battery. This is used to monitor battery state from the backend and generate alerts when it is almost depleted, but also to alter operation to prioritize power over performance in situations where it is needed. | ### Power consumption and battery lifetime [Section titled “Power consumption and battery lifetime”](#power-consumption-and-battery-lifetime) The Logger has 3 operational states, which have very different power consumptions: | State | Description | Power consumption (typical) | | ------------ | ---------------------------------------------------------------------------------------------------------------------------------------------------------------------------------------------------------------------------- | --------------------------- | | Deep sleep | When the Logger is not actively performing a measurement or transmitting data, it goes to deep sleep to preserve power. In most configurations, it spends most of its time in deep sleep. | 0.2 mW | | Measurement | The Logger periodically wakes up to perform a measurement, save the result in its internal flash storage and then go back to sleep. The power consumption during measurement depends a lot on the type of sensors connected. | 150 to 500 mW | | Transmission | Transmission is by far the largest power consumer, and thus often dictates the battery lifetime. | 1600 mW | The user can configure the **measurement interval** and the **transmission interval** for each Logger through Consibio Cloud: 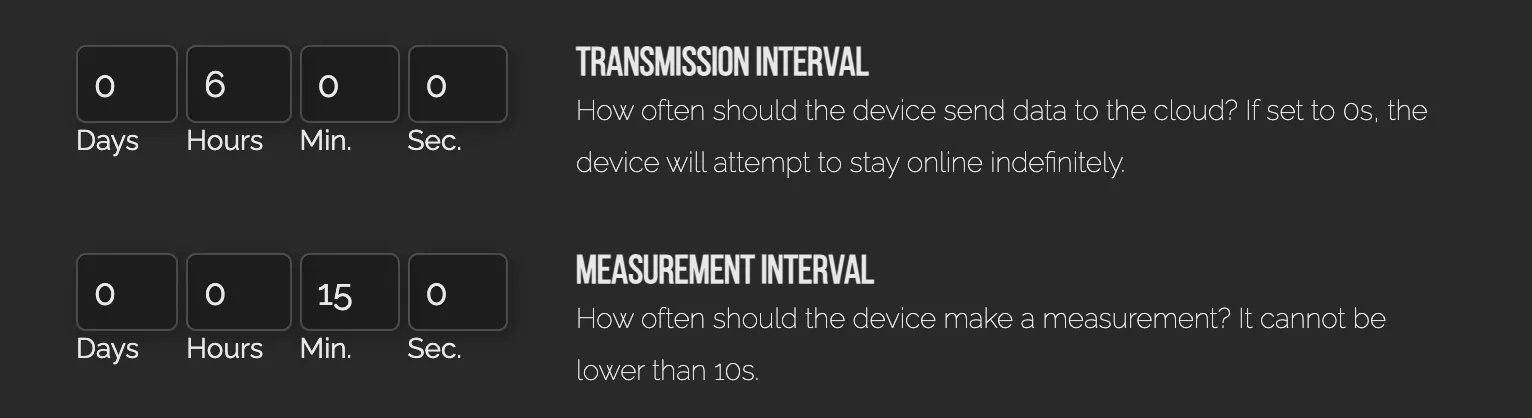 These settings dictate how much time the Logger spends in each state and thus the effective battery life. Below are discharge curves shown for typical setups: 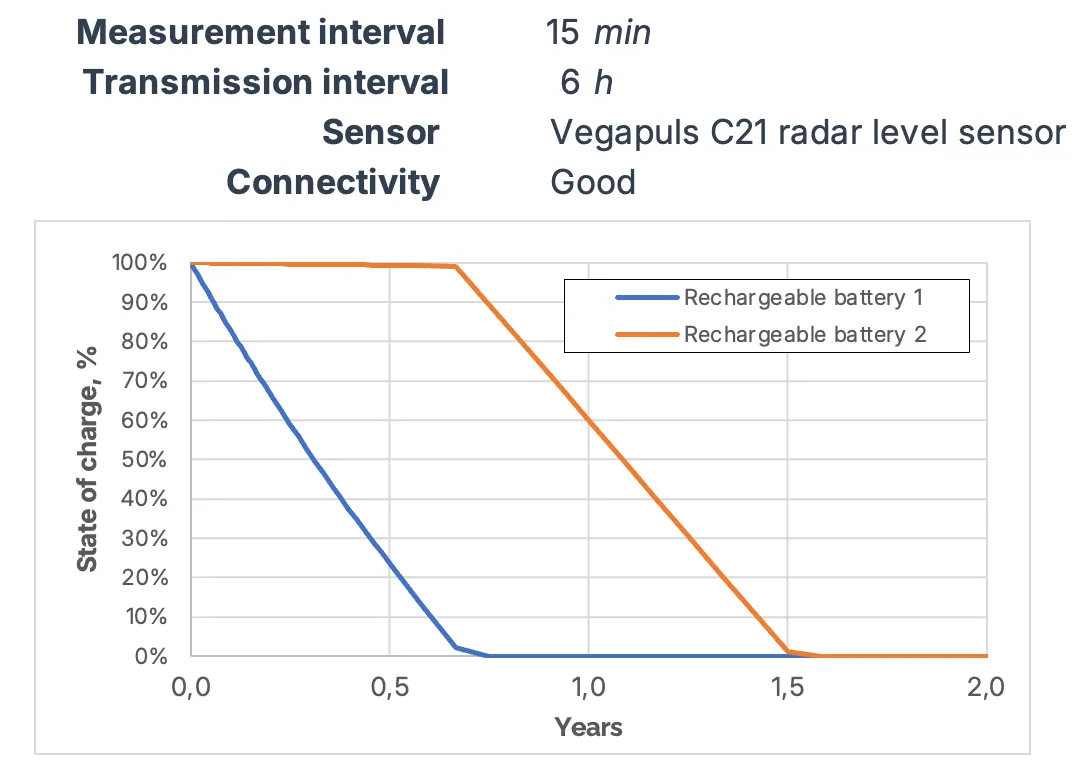 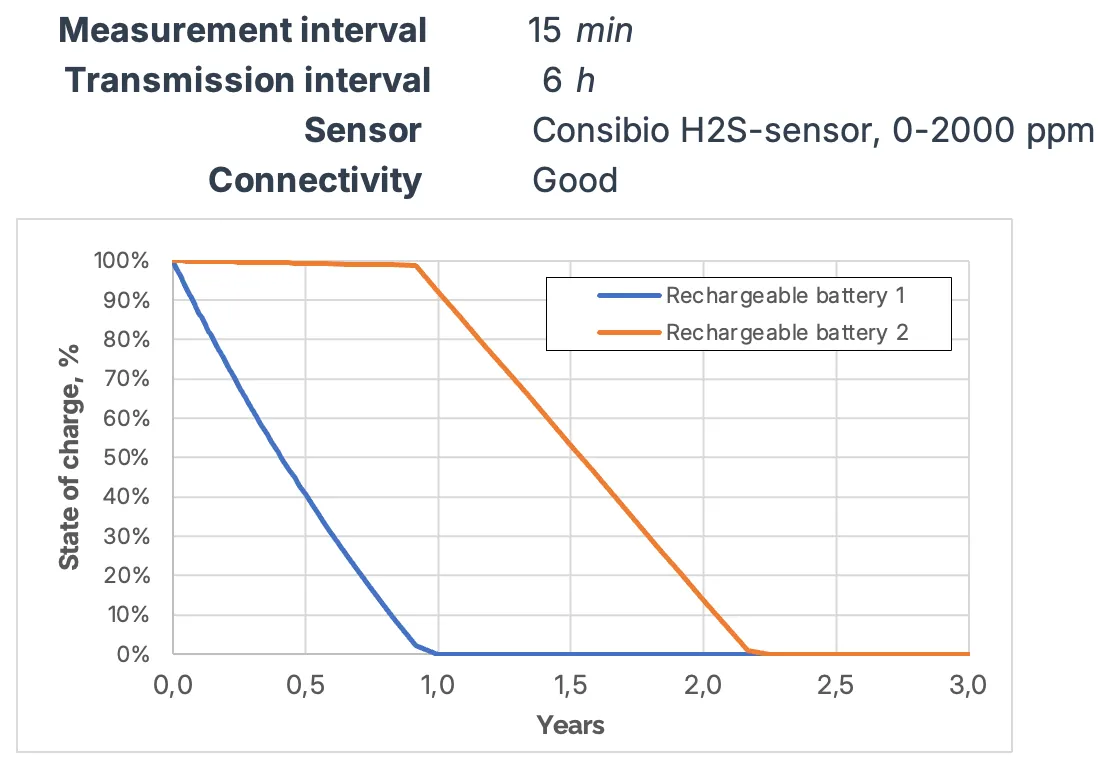 The figures above are **estimates**. The transmission power and time depend highly on the quality of the cellular connection and can thus vary significantly if connectivity is very poor.
# Setting up a local Wi-Fi hotspot fallback
> Configure a device to fall back to a local Wi-Fi hotspot when its primary connection is unavailable.
Consibio Logger devices connect primarily via cellular and continuously scan for and select the best operator in the area based on performance metrics collected by the device itself. If a device is not able to establish a proper cellular connection, it tries to connect to a local Wi-Fi network through an automated fallback mechanism. The credentials for this Wi-Fi network are predetermined. If you have a local device that can’t connect via cellular, you can set up a local Wi-Fi hotspot with these credentials to let the device connect through the hotspot instead. This makes it much easier for Consibio’s support partners to help identify potential issues. ## Credentials [Section titled “Credentials”](#credentials) Set up the Wi-Fi hotspot with credentials exactly as defined below: | Parameter | Value | | ------------------- | -------------- | | SSID (network name) | `Consibio IoT` | | Password | `Cnsb20:Wf` | It’s completely secure to use this mechanism, even though everyone can know the password based on the above — see [Security](#security) below for more information. ## Set up the fallback [Section titled “Set up the fallback”](#set-up-the-fallback) 1. **Disconnect all power sources from the device.** Be sure to disconnect both wired power and batteries. 2. **Create and activate the hotspot with the credentials above.** See [Set up a hotspot on an iPhone](#set-up-a-hotspot-on-an-iphone) or [Set up a hotspot on an Android phone](#set-up-a-hotspot-on-an-android-phone) below. 3. **Reconnect the power sources.** Ensure the batteries are charged if a wired power supply isn’t used. 4. **Wait.** It can take up to 10–15 minutes before the device uses the fallback and attempts to connect via Wi-Fi. If this doesn’t happen, there’s probably another issue with the device — reach out to for further instructions. If you’re using an iPhone, keep the screen active during this period. Otherwise, it might automatically disable the hotspot. ## Hotspot setup guide [Section titled “Hotspot setup guide”](#hotspot-setup-guide) The hotspot can be created with any Wi-Fi access point, but it’s often convenient to use a smartphone as the local hotspot. Below is how this is commonly set up on popular smartphone platforms. ### Set up a hotspot on an iPhone [Section titled “Set up a hotspot on an iPhone”](#set-up-a-hotspot-on-an-iphone) To set up a Wi-Fi hotspot compatible with Consibio Logger on an iPhone: 1. Open the **Settings** app. 2. Select **General**. 3. Select **About**. 4. Select **Name** and change it to (be aware of the letter casing): **Consibio IoT** 5. Select **OK** on the keyboard. 6. Go back to the front page of the Settings app. 7. Select **Personal Hotspot**. 8. Select **Wi-Fi Password** and change it to: **Cnsb20:Wf** 9. Ensure that **Allow Others to Join** is enabled. 10. Ensure that **Maximize Compatibility** is enabled. 11. Activate the hotspot. 12. Close the Settings app but keep the screen active until the device connects — otherwise, the iPhone might automatically close the hotspot again. ### Set up a hotspot on an Android phone [Section titled “Set up a hotspot on an Android phone”](#set-up-a-hotspot-on-an-android-phone) To set up a Wi-Fi hotspot compatible with Consibio Logger on an Android smartphone: 1. Open the **Settings** app. 2. Select **Connection & sharing**. 3. Select **Personal hotspot**. 4. Select **Hotspot settings**. 5. Under **Hotspot name (required)**, change the name to: **Consibio IoT** 6. Under **Password**, change it to: **Cnsb20:Wf** 7. Under **Security**, select **WPA2/WPA3-Personal** (this is usually selected by default). 8. Under **AP band**, select **2.4 GHz**. 9. Activate the hotspot. ## Security [Section titled “Security”](#security) It’s completely secure to let everyone know the Wi-Fi credentials listed above, since they can’t be used to gain improper access to devices or data, or to impersonate devices: * Consibio Logger treats **all** networks as insecure. All communication to and from the devices is encrypted using the latest standards (TLS 1.3). If someone with malicious intent sets up a Wi-Fi access point that a device connects to, they still can’t retrieve the data. * The devices **never** accept incoming requests over a network — a session is always initiated by the device to a trusted source. * A Wi-Fi network can’t be used to prevent a device from connecting and impose a loss of function. A device always attempts to connect via cellular first; only if that fails does it attempt Wi-Fi. If the Wi-Fi network doesn’t allow the outgoing requests the device makes, the device automatically disconnects from the Wi-Fi network and retries the cellular connection. ## Troubleshooting [Section titled “Troubleshooting”](#troubleshooting) * **The device never falls back to Wi-Fi** — wait the full 10–15 minutes before assuming it’s not working. If it still doesn’t connect, there’s likely another issue with the device. * **An iPhone hotspot turns off on its own** — keep the iPhone’s screen active while waiting for the device to connect; iOS can disable the hotspot automatically once the screen locks. If these steps don’t resolve the issue, reach out to .
# Troubleshooting inaccurate flow readings
> Check whether a Consibio level-based flow reading is accurate and correct the installation height or pipe slope if it isn't.
On a level-based flow installation, Consibio does not measure flow directly. The flow is **calculated** from the water level the radar measures and the geometry of the pipe: * **A, Installation height** — the distance from the bottom of the level sensor to the bottom of the invert. * **D, Pipe diameter.** * **S, Pipe slope.** Because the flow is derived from these values, if any one of them is off, the calculated flow is off too. When a reading looks wrong, the fastest way to find the cause is to work back through the chain: first check the water level, then the installation height, then the slope. If you have the [Advanced Flow solution](/cloud/devices/installing-the-advanced-flow-solution/), a surface-velocity radar also feeds into the calculation — see [Calibrating velocity measurements](/cloud/devices/calibrating-velocity-measurements/) for that setup. This article covers the level-and-slope flow calculation. ## Signs a flow reading may be inaccurate [Section titled “Signs a flow reading may be inaccurate”](#signs-a-flow-reading-may-be-inaccurate) * The reported flow does not match a quick hand calculation or a visual check of the pipe network — for example, a manhole that reads a steady \~6000 gpm that the pipe clearly can’t be carrying. * The flow is suspiciously flat or steady when you’d expect it to rise and fall over the day. * The flow is consistently a round multiple (roughly 2×, ½×, …) of what you expect, which often points to a single wrong input rather than a real change. Local flow conditions such as turbulence, waves or foam at the sensor can also disturb the radar’s level reading, so start by confirming the level is correct. ## 1. Measure the water level manually [Section titled “1. Measure the water level manually”](#1-measure-the-water-level-manually) Take a manual measurement of the water level on site — for example with a dip rod lowered to the bottom of the invert. Note both the **value** and the **exact time** of the measurement, because you’ll compare it against the reading stored at that same moment. ## 2. Compare it against the level in the dashboard [Section titled “2. Compare it against the level in the dashboard”](#2-compare-it-against-the-level-in-the-dashboard) Open the project in Consibio Cloud at [v3.consibio.cloud](https://v3.consibio.cloud) and open the widget or element that shows the water level. Hover the point at the time you noted down and read off the stored value: 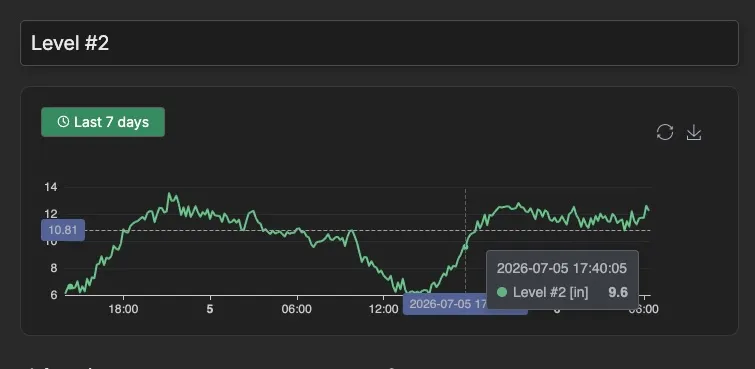 Compare this stored value with your manual measurement: * If the two **match**, the level is good — the error is elsewhere, so continue to [step 4](#4-if-the-level-is-correct-adjust-the-pipe-slope). * If they **don’t match**, the installation height is likely wrong — continue to step 3. ## 3. If the level is wrong, correct the installation height [Section titled “3. If the level is wrong, correct the installation height”](#3-if-the-level-is-wrong-correct-the-installation-height) If the stored level doesn’t match your manual measurement, adjust the **installation height (A)** in the flow calculation setup — the distance from the bottom of the level sensor to the bottom of the invert. A wrong installation height is the most common cause of an inaccurate level, because it sets the reference the radar distance is subtracted from. 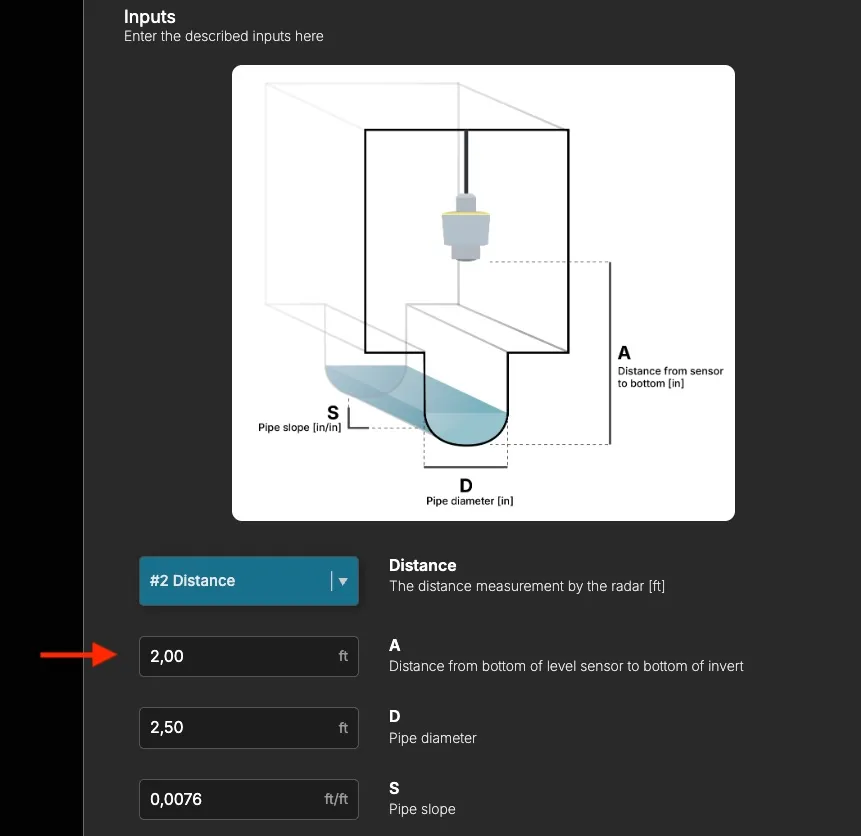 Set **A** so that the calculated level matches your manual measurement, then re-check the level in the dashboard. For how to derive an accurate installation height, see [Installing the Level & Flow solution for Logger WD-68](/cloud/devices/installing-the-level-flow-solution-for-logger-wd-68/). ## 4. If the level is correct, adjust the pipe slope [Section titled “4. If the level is correct, adjust the pipe slope”](#4-if-the-level-is-correct-adjust-the-pipe-slope) If the level matches but the flow is still wrong, the **pipe slope (S)** is the next input to check, since flow scales with the slope. Look up the slope in the pipeline documentation for the manhole and enter it, or adjust it to bring the flow into line — if the flow reads about **twice** what it should, halve the slope; if it reads about **half**, double it. 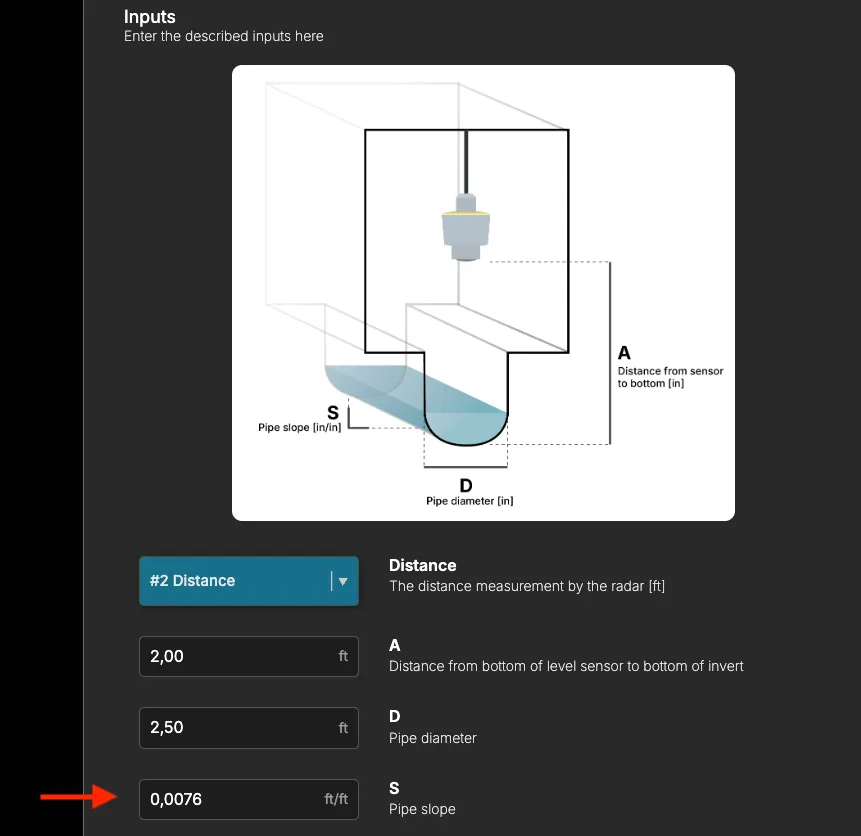 Also confirm the **pipe diameter (D)** matches the pipe on site — a wrong diameter shifts the flow as well. ## Troubleshooting [Section titled “Troubleshooting”](#troubleshooting) * **The level is right but the flow still looks off** — re-check the pipe slope (**S**) and diameter (**D**) against the pipeline documentation. * **The level jumps around or won’t settle** — turbulence, waves or foam at the surface can disturb the radar. Check the sensor is mounted over calm water and aimed straight down at the surface. * **You’re not sure which input is wrong** — send us the manual water level and the time you measured it, and we’ll help work back through the calculation. If the reading still doesn’t look right after checking the level, installation height, slope and diameter, reach out to .
# Getting started with Consibio Cloud
> Create your account, join a project and find your way around Consibio Cloud.
Consibio Cloud is your window into your Consibio devices: live measurements, historical data, alarms, reports and remote control — all in one place. ## Sign in [Section titled “Sign in”](#sign-in) 1. Go to [v3.consibio.cloud](https://v3.consibio.cloud). 2. Sign in with your e-mail address and password. * If your organization already uses Consibio Cloud, ask a project administrator to [invite you](/cloud/projects/inviting-team-members/) — you’ll receive an e-mail with a link to create your account. ## Projects [Section titled “Projects”](#projects) Everything in Consibio Cloud lives inside a **project**: devices, sensor data, alarms, reports and team members. When you sign in you’ll land in your default project. If you’re a member of several projects, use the project switcher in the menu to change between them. ## Find your way around [Section titled “Find your way around”](#find-your-way-around) The main menu gives you access to: * **Dashboard** — widgets with live and historical measurements from your devices. * **Devices** — every device in the project, its status and battery level. See [Claiming a device](/cloud/devices/claiming-a-device/). * **Alarms** — rules that notify you when a measurement goes out of range. See [Creating an alarm](/cloud/alarms/creating-an-alarm/). * **Reports** — periodic summaries of your data. * **Users** — the members of your project and their roles. * **Settings** — project configuration. ## Next steps [Section titled “Next steps”](#next-steps) * [Claim your first device](/cloud/devices/claiming-a-device/) * [Create an alarm](/cloud/alarms/creating-an-alarm/) * [Invite your team](/cloud/projects/inviting-team-members/)
# Install Consibio Cloud as an app
> Add Consibio Cloud to your phone's home screen so it opens like a normal app.
Consibio Cloud is a web app, but your phone’s browser can install it to your home screen so it opens full-screen, without the browser’s address bar — just like a normal app. ## iOS (iPhone) [Section titled “iOS (iPhone)”](#ios-iphone) 1. Open [v3.consibio.cloud](https://v3.consibio.cloud) in **Safari**. 2. Tap the share icon in the toolbar. 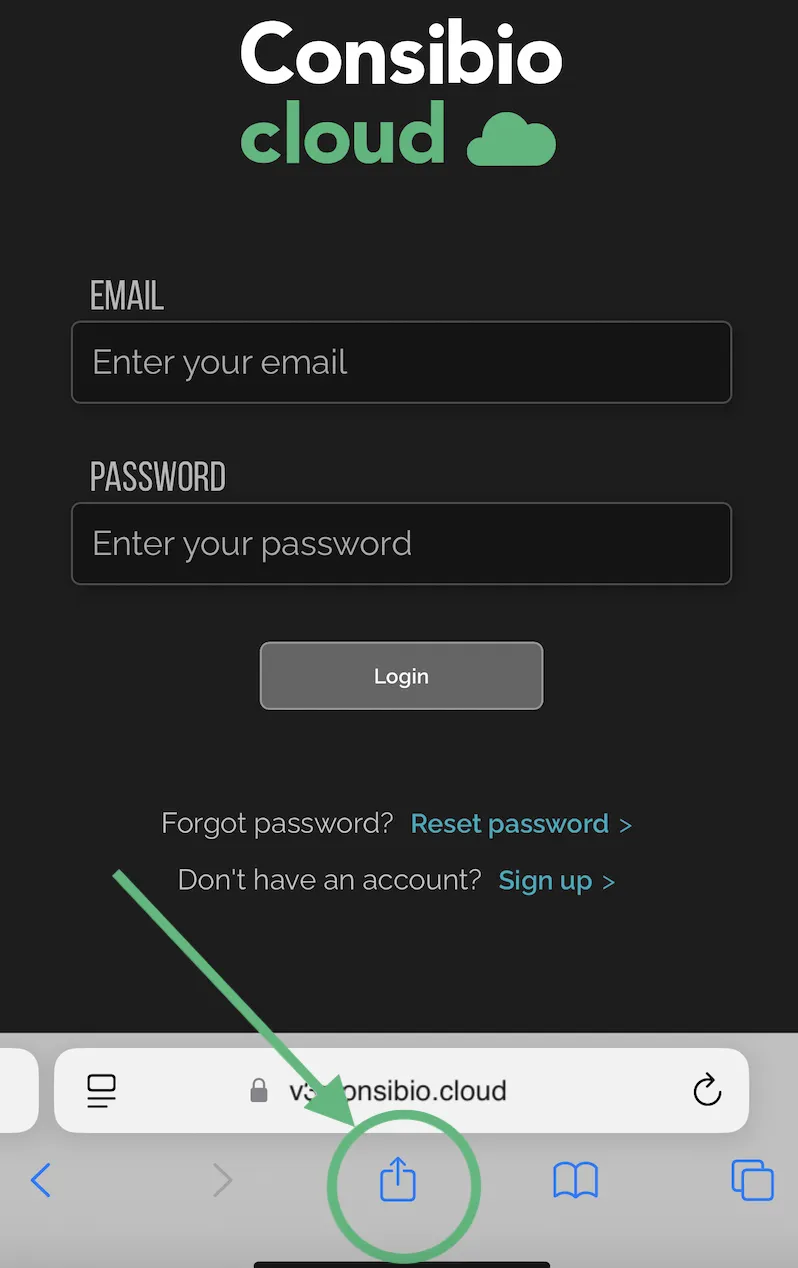 3. Tap **Add to Home Screen**. 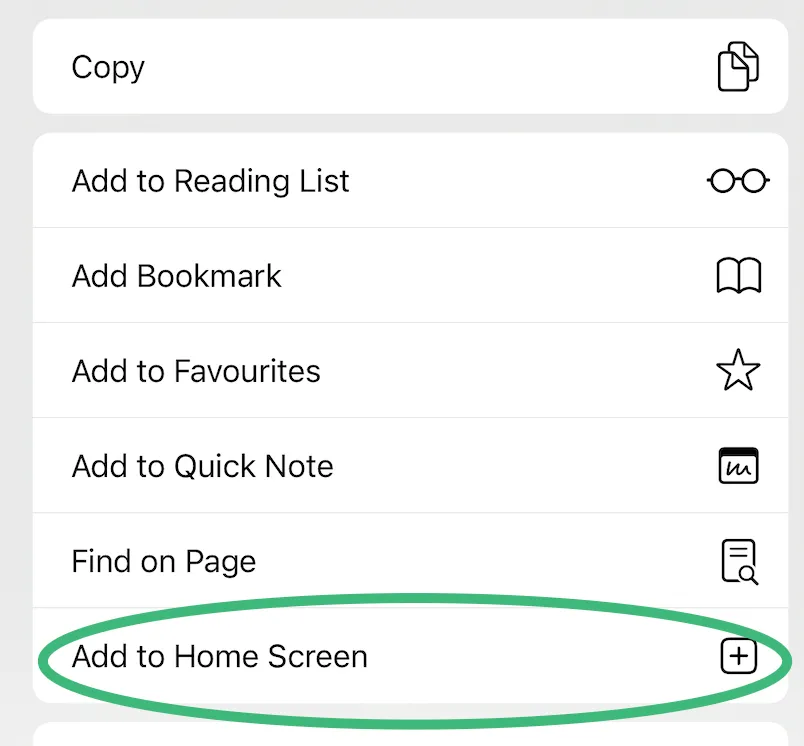 4. Tap **Add**. 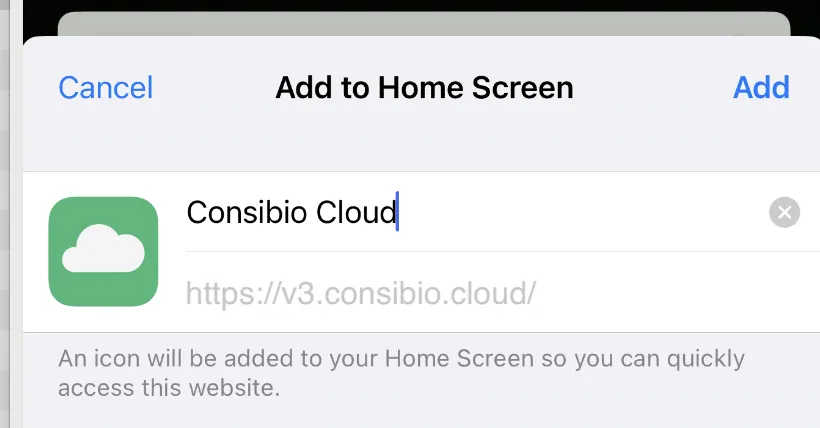 5. Consibio Cloud now appears on your home screen as an app icon. 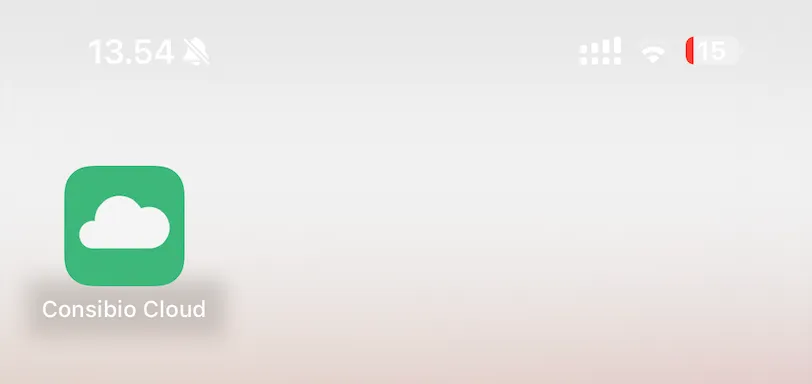 ## Android [Section titled “Android”](#android) 1. Open [v3.consibio.cloud](https://v3.consibio.cloud) in **Chrome**. 2. Tap the menu (⋮) in the top-right corner and select **Add to Home screen**. 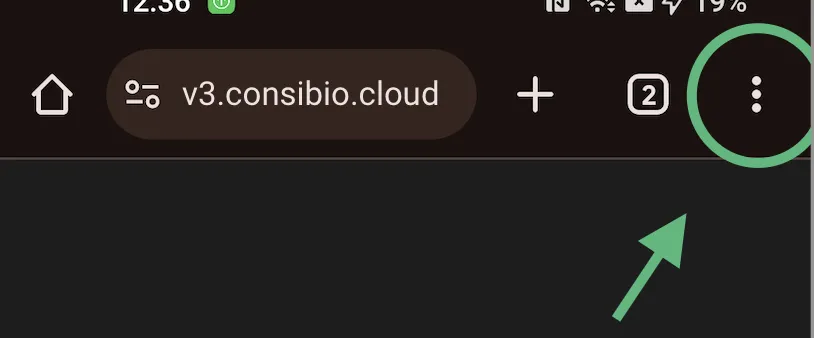 3. Confirm by tapping **Add**. 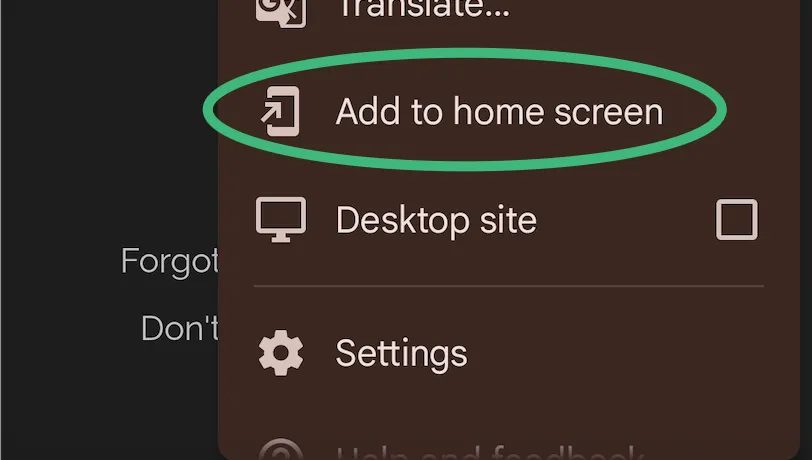 4. Consibio Cloud now appears on your home screen as an app icon.  ## Support [Section titled “Support”](#support) Questions about installing Consibio Cloud? Contact .
# Privacy policy
> How Consibio ApS collects, uses and protects the personal information you share with Consibio Cloud.
This Privacy Policy explains the policies of Consibio ApS on the collection and use of the information we collect when you access the Consibio Cloud web platform via , or (the “Service”). This Privacy Policy describes your privacy rights and how you are protected under privacy laws. By using our Service, you are consenting to the collection and use of your information in accordance with this Privacy Policy. Please do not access or use our Service if you do not consent to the collection and use of your information as outlined in this Privacy Policy. Consibio ApS is authorized to modify this Privacy Policy at any time. This may occur without prior notice. Consibio ApS will post the revised Privacy Policy on this site. ## Collection and use of your personal information [Section titled “Collection and use of your personal information”](#collection-and-use-of-your-personal-information) ### Information we collect [Section titled “Information we collect”](#information-we-collect) When signing up for our Service, you will be prompted to provide us with personal information used to set up your account, authenticate you in subsequent logins and provide you with notifications from the platform. You are asked to provide the following information: * Name (required) * Email (required) * Password (required) * Mobile number (optional) * Company name (optional) In addition to this, we collect Usage Data when you utilize the platform for session logging. We do this for both security monitoring and for optimizing platform features. Usage Data includes the following: * Internet Protocol (IP) address of computers accessing the Service. * Browser used to access site. * Time and date of access. * Interactions on the site during an open session. ### How we collect information [Section titled “How we collect information”](#how-we-collect-information) The Service collects and receives information from you in the following manner: * When you sign up for a user account with the Service. * When you interact with our Service. Your information will be stored for up to 365 days after it is no longer required to provide you the services. Your information may be retained for longer periods for reporting or record-keeping in accordance with applicable laws. Information which does not identify you personally may be stored indefinitely. ### How we use your information [Section titled “How we use your information”](#how-we-use-your-information) The Service may use your information for the following purposes: * Providing and maintaining our Service, as well as monitoring the usage of our Service. * To contact you. We will contact you in relation to the functions, products, services, or security updates when necessary or reasonable. * We will only contact you via phone and SMS to provide notifications from the Service related to alarm notification functionalities in the Service you have explicitly and actively subscribed to. At any time, you can also choose to unsubscribe from these alarms to stop receiving the related SMS messages or calls. Subscribing and unsubscribing to alarm notifications (and thus all SMS messages and calls) is done by the user directly in the web platform of the Service. ### How we share your information [Section titled “How we share your information”](#how-we-share-your-information) Consibio ApS will share your information, when applicable, in the following situations: * With your consent. Consibio ApS will share your information for any purpose with your explicit consent. #### Third-party sharing [Section titled “Third-party sharing”](#third-party-sharing) The data collected by the Service is only used for the functionality of the Service and to provide you notifications that are part of the Service’s offerings (like alarms and automated reports). We only share the required parts of your data with subcontracting third parties, when it is required to provide the functionalities of the Service. This includes: * Sharing your phone number with our SMS/call service provider, as the recipient of an SMS notification or automated call for alarm notifications (but only when you have explicitly subscribed to that in the web portal of the Service). * Sharing your email with our email service provider, as the recipient of an email notification for e.g. an alarm or an automated report (but only when you have explicitly subscribed to that in the web portal of the Service). We never share Usage Data with any third parties. No data (including mobile information) will be shared with third parties or affiliates, for marketing or promotional purposes. If you choose to provide the information listed here during signup or otherwise, you are giving Consibio ApS permission to use, share, and store that information in a manner consistent with this Privacy Policy. Your information may be disclosed for additional reasons, including: * Complying with applicable laws, regulations, or court orders. * Responding to claims that your use of our Service violates third-party rights. * Enforcing agreements you make with us, including this Privacy Policy. ### Cookies [Section titled “Cookies”](#cookies) The Service does not use cookies or collect any data through cookies. ### Security [Section titled “Security”](#security) Your information’s security is important to us. utilizes a range of security measures to prevent the misuse, loss, or alteration of the information you have given us. This includes but is not limited to: * Only providing access to the service through TLS encrypted connections. * Safeguarding access to your data through a comprehensive set of internal Identity and Access Management (IAM) tools ensuring 3rd parties cannot gain unauthorized access to your data. * Encrypting your data at rest using modern encryption standards. However, because we cannot guarantee the security of the information you provide us, you must access our service at your own risk. For more detail on how Consibio Cloud is secured end-to-end, see [Security in Consibio Cloud](/cloud/security-in-consibio-cloud/). ### Contact us [Section titled “Contact us”](#contact-us) For any questions, please contact us through the following methods: **Name**: Consibio ApS **Address**: Sindalsvej 37, 8240 Risskov **Email**: **Website**: **Phone**: [+45 20 68 71 89](tel:+4520687189) ## Revisions [Section titled “Revisions”](#revisions) | Version | Comments | | ---------- | ------------------------------ | | 2025-02-08 | Policy uploaded to help center | | 2026-07-06 | Reviewed for accuracy |
# Converting a measurement with a lookup table
> Use the lookup table virtual sensor to convert one measurement into another by interpolating between user-defined value pairs.
Sometimes a measurement needs a custom, non-linear conversion — for example turning a level measurement into the volume of an irregular tank, or mapping a raw sensor signal onto a calibrated scale. The **Lookup table** virtual sensor does this by converting a single input to a single output using a table of value pairs you define. Between two rows of the table, the output is calculated by linear interpolation. If the input goes below the lowest input value in the table — or above the highest — the output is capped to the output value of the first or last row. ## Create the virtual sensor [Section titled “Create the virtual sensor”](#create-the-virtual-sensor) 1. Open the **Virtual Sensors** view. 2. Create a new virtual sensor and select the type **Lookup table**. 3. Under **Inputs**, select the element with the measurement you want to convert. 4. Define the lookup table: each row maps an input value to an output value. Use **Add row** to extend the table — up to 10 rows — and remove rows you don’t need. The rows don’t have to be entered in order; they are sorted by input value automatically. 5. Under **Outputs**, select (or create) the element where the converted value should be saved. 6. Save the virtual sensor. Every time the input element receives a new value, the device converts it through the lookup table and saves the result to the output element. ## Example [Section titled “Example”](#example) A lookup table for converting a liquid level (in meters) to a volume (in liters) in a tank with an irregular shape: | Input (level, m) | Output (volume, L) | | ---------------- | ------------------ | | 0.0 | 0 | | 0.5 | 120 | | 1.0 | 300 | | 1.5 | 650 | A level of 0.75 m falls between the second and third rows, so the volume is interpolated to 210 L. A level of 2.0 m is above the last row, so the volume is capped at 650 L. ## Troubleshooting [Section titled “Troubleshooting”](#troubleshooting) * **No values appear on the output element**: check that the input element receives values, that it comes from a device (the lookup table virtual sensor cannot run in the cloud), and that the device is online and has a recent firmware version. * **The output is stuck at the same value**: the input may be outside the table’s boundaries, where the output is capped to the first/last row. If self-help runs out, contact .
# Inviting team members
> Give colleagues access to your project and manage their roles.
Consibio Cloud is built for teams: everyone in a project sees the same devices, data and alarms. You control who has access — and what they can do — from the **Users** view. ## Invite a member [Section titled “Invite a member”](#invite-a-member) 1. Open the **Users** view from the main menu. 2. Select **Add member**. 3. Enter your colleague’s e-mail address. 4. Choose their role (see below). 5. Send the invitation. Your colleague receives an e-mail with a link. If they don’t have a Consibio Cloud account yet, they’ll be asked to create one — and they’ll land directly in your project. ## Roles [Section titled “Roles”](#roles) | Role | Can do | | ----------------- | -------------------------------------------------------------------------- | | **Viewer** | See dashboards, devices, data and alarms. | | **Editor** | Everything a viewer can, plus configure devices, alarms and widgets. | | **Administrator** | Everything an editor can, plus manage members, roles and project settings. | ## Removing a member [Section titled “Removing a member”](#removing-a-member) Administrators can remove a member from the Users view. Removing a member immediately revokes their access to the project — their user account and any other project memberships are unaffected.
# Creating a report
> Set up periodic reports and export your project's data.
Reports give you a recurring summary of your project’s data — delivered automatically, so you don’t have to log in and export data by hand. ## Set up a report [Section titled “Set up a report”](#set-up-a-report) 1. Open the **Reports** view from the main menu. 2. Select **Setup new report**. 3. Choose what the report should include and how often it should be generated. 4. Save the report. ## Export data once [Section titled “Export data once”](#export-data-once) If you just need the data right now instead of a recurring report, use **Export data** in the Reports view to download your project’s measurements. See [Exporting data to CSV](/cloud/reports/exporting-data-to-csv/) for the full walkthrough. ## Support [Section titled “Support”](#support) Questions about reports? Contact .
# Exporting data to CSV
> Download your project's measurements as a CSV file for use in Excel or another tool.
Consibio Cloud can export your project’s measurements as a CSV file, which opens directly in Excel or any other spreadsheet tool. ## Export data [Section titled “Export data”](#export-data) 1. Open the **Reports** view from the main menu. 2. Select **Export data**. 3. Under **Type**, keep **CSV export** selected. 4. Under **Elements**, choose which measurements to include. If you don’t select any, all elements are included. 5. Choose the **time range** the export should cover. 6. Optionally set **Align timestamps** to an interval (for example 60s) so every element’s readings line up on the same rows. Leave it at 0s to export each element’s raw, unaligned timestamps. 7. Select **Download**. Your browser downloads a file named `Consibio Cloud Datalog.csv`. ## Opening the file in Excel [Section titled “Opening the file in Excel”](#opening-the-file-in-excel) Double-click the downloaded file to open it in Excel. Depending on your Windows system language, Excel may not split the columns correctly on the first open — if that happens, select column A, then use **Data > Text to Columns** in Excel’s toolbar to split it, choosing **Comma** as the delimiter. ## Support [Section titled “Support”](#support) Need help with a data export or import? Contact — we can help with imports on Mac, Windows, Linux and specific Excel versions.
# Security in Consibio Cloud
> How Consibio Cloud protects your data across devices, the cloud platform and user access.
Consibio Cloud collects remote data from IoT dataloggers and handles all data processing, analysis, storage and visualization, alongside the tools needed to manage the dataloggers. There are three layers in this setup, and the exchange of data between them: 1. **Dataloggers** — sample measurements and send them to the cloud. 2. **Consibio Cloud** — the central hub for storing and managing all data, configurations and analysis. 3. **External accessors** — human users who access Consibio Cloud through the user interface, and service accounts that access data programmatically. Each layer — and the exchange of data between layers — is protected using industry-standard security practices: 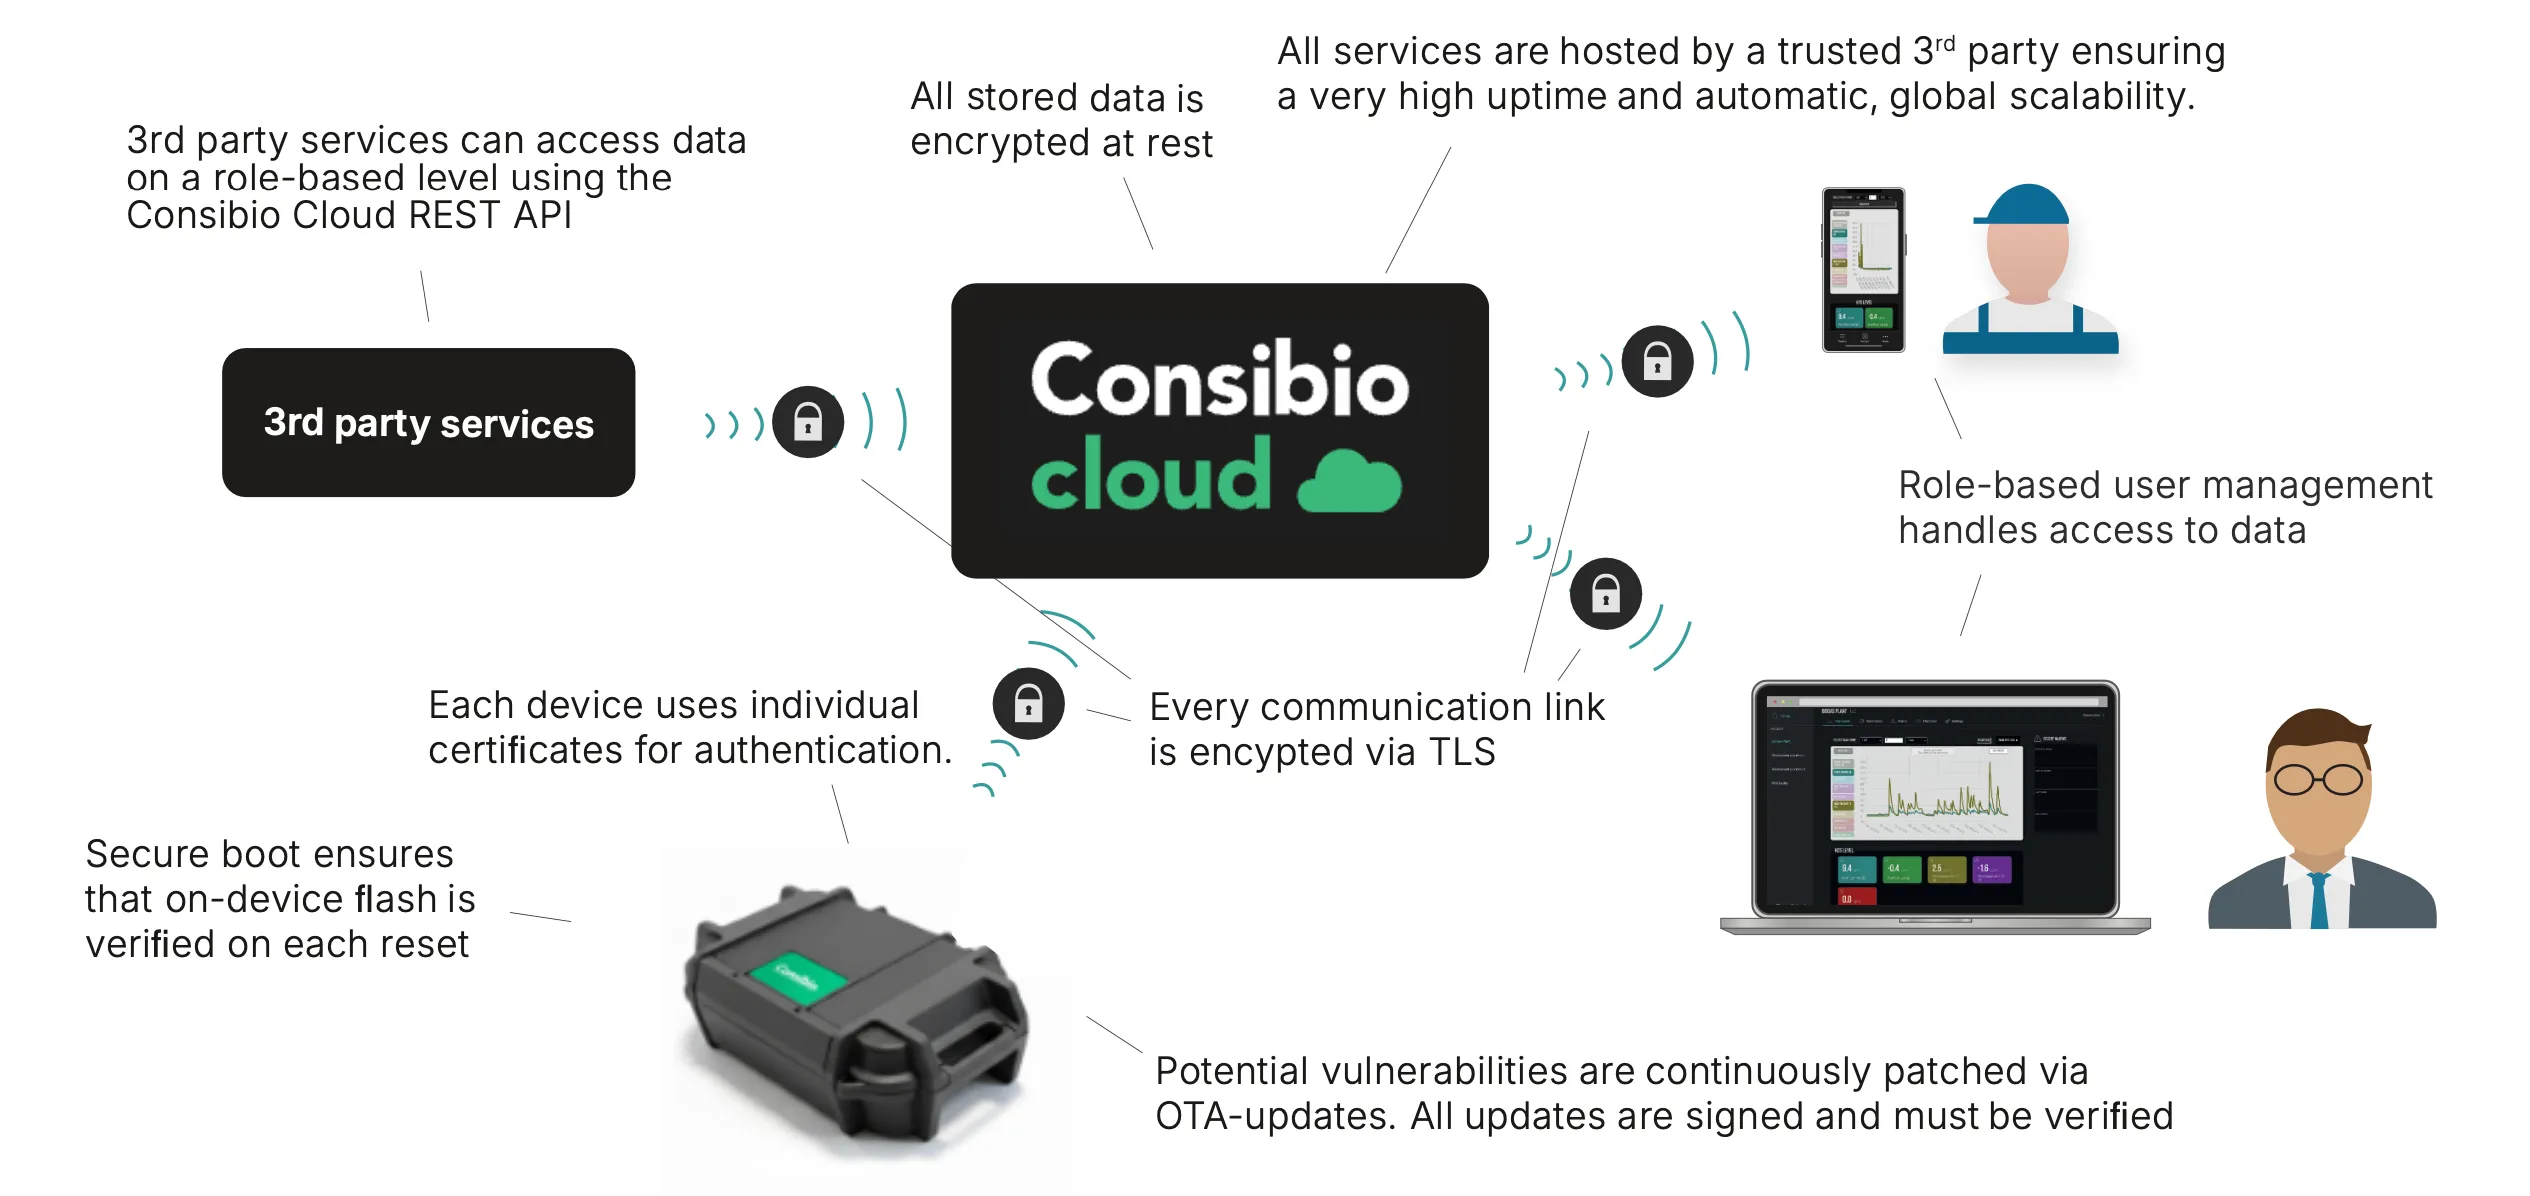 ## Dataloggers [Section titled “Dataloggers”](#dataloggers) * Uses a secure boot mechanism to ensure that on-device flash is verified on each reset. * Potential vulnerabilities are continuously patched via over-the-air (OTA) updates. All updates are signed and must be verified before they execute on the device. * Communication sessions are always initiated by the device going out to Consibio Cloud, so there are no open services or ports on the device — third parties cannot communicate with the devices directly. * All communication links are encrypted using TLS v1.3. * Each device uses individual x509 certificates for authentication. ## Consibio Cloud [Section titled “Consibio Cloud”](#consibio-cloud) * All services are hosted by a trusted third party, ensuring high uptime and automatic, global scalability. * All stored data is encrypted at rest. * Multiple services continuously scan all activity for vulnerabilities or malicious requests. * All incoming and outgoing communication channels require strong authentication and TLS encryption. * All data is divided into sandboxed **projects**. Users are granted role-based access to data at the project level. * Data backups are performed daily and stored for at least 1 month. ## Users and external accessors [Section titled “Users and external accessors”](#users-and-external-accessors) * Role-based user management controls access to data. * Third-party services can access data at a role-based level using the [Consibio Cloud REST API](/integrations/api/). * All unauthenticated access requests are denied. * All data requests must be made over a TLS-encrypted link. ## Support [Section titled “Support”](#support) Questions about Consibio Cloud’s security? Contact .
# Consibio Cloud API
> Access your project's data programmatically through the Consibio Cloud REST API.
Consibio Cloud exposes a REST API that lets you read and manage your projects, devices, elements, datalog and alarms programmatically — for example to pull measurements into your own systems. The API base URL is:
```plaintext
https://api.v2.consibio.cloud
```
## Authentication [Section titled “Authentication”](#authentication) The API uses Bearer tokens. Obtain a token with your Consibio Cloud credentials:
```bash
curl -s -X POST https://api.v2.consibio.cloud/oauth/token \
-H 'Content-Type: application/json' \
-d '{"username":"you@example.com","password":"yourpassword","grant_type":"password"}'
```
The response contains an `access_token`. Send it on every request:
```bash
curl -s https://api.v2.consibio.cloud/projects \
-H 'Authorization: Bearer YOUR_TOKEN'
```
Treat tokens like passwords: store them securely and revoke them if they leak. ## Endpoint overview [Section titled “Endpoint overview”](#endpoint-overview) The API is organized around projects: devices, elements (measurements), datalog, alarms, controllers, locations, members, reports and widgets are all accessed under `/projects/{project_id}/…`. The full endpoint reference (OpenAPI/Swagger) is published at . For a worked example of pulling historical data for a project, see [Pulling datalogs with the REST API](/integrations/pulling-datalogs-with-the-rest-api/). If you don’t have hardware yet, you can try the API against simulated data — see [Testing the REST API with a demo project](/integrations/testing-the-rest-api-with-a-demo-project/). ## Using AI assistants instead [Section titled “Using AI assistants instead”](#using-ai-assistants-instead) If you want an AI assistant (like Claude) to work with your data — rather than writing integration code yourself — use the MCP server instead: [Connecting an AI assistant (MCP)](/integrations/mcp/). ## Support [Section titled “Support”](#support) For API access and questions, contact .
# Connecting an AI assistant to the Help Center
> Give Claude or another AI assistant access to all Consibio Help Center articles, so it can answer in-depth support questions about Consibio products.
You can give an AI assistant — like Claude — access to everything in this Help Center, so it can answer support questions about Consibio Cloud, Consibio devices and integrations with up-to-date, accurate knowledge. No Consibio account is needed: the Help Center is public. There are two ways to do it, from quickest to most capable. ## Option 1: Paste an `llms.txt` link [Section titled “Option 1: Paste an llms.txt link”](#option-1-paste-an-llmstxt-link) The Help Center publishes its full content in plain-text formats made for language models: * — an index describing the available sets * — the full documentation, compacted * — the complete documentation Paste one of these URLs into your AI tool (or your prompt) and ask your question. This works with any assistant that can read a link — no setup at all. ## Option 2: Connect the Help Center MCP server [Section titled “Option 2: Connect the Help Center MCP server”](#option-2-connect-the-help-center-mcp-server) For AI agents you use regularly, the MCP (Model Context Protocol) server is the better fit: instead of reading the whole documentation every time, the assistant can search the Help Center and fetch exactly the articles it needs, and it always sees the latest published content. 1. Open your Claude Desktop configuration file: * macOS: `~/Library/Application Support/Claude/claude_desktop_config.json` * Windows: `%APPDATA%\Claude\claude_desktop_config.json` 2. Add the Help Center MCP server — no token or account is required:
```json
{
"mcpServers": {
"consibio-help-center": {
"type": "http",
"url": "https://docs-mcp.consibio.cloud/mcp"
}
}
}
```
3. Restart Claude Desktop. The Help Center tools appear in the tools menu. Other MCP clients work the same way: point them at the same URL (streamable HTTP transport), with no authentication headers. ## What the assistant can do [Section titled “What the assistant can do”](#what-the-assistant-can-do) The server exposes three tools: * **search\_help\_center** — search all articles by keyword, optionally filtered by product (`cloud`, `devices`, `api`). * **get\_article** — read the full text of one article, including its canonical URL and PDF link, so the assistant can cite its sources. * **list\_articles** — list every published article. Try prompts like *“How do I calibrate the H2S sensor?”* or *“Walk me through claiming a device and setting up an alarm on it.”* — the assistant will look up the relevant articles and answer from them, with links. ## Help Center knowledge vs. your live data [Section titled “Help Center knowledge vs. your live data”](#help-center-knowledge-vs-your-live-data) This server only knows the *documentation* — it cannot see your projects or measurements. To let an assistant also work with your live Consibio Cloud data (read measurements, check device health, manage alarms), connect the [Consibio Cloud MCP server](/integrations/mcp/) as well; the two work well together, and that one requires your API token. ## Troubleshooting [Section titled “Troubleshooting”](#troubleshooting) * **The tools don’t appear** — check the config file is valid JSON and restart the client. * **The assistant’s answers seem outdated** — the server refreshes its copy of the Help Center within a few minutes of a release; try again shortly. Still stuck? Contact .
# Connecting an AI assistant (MCP)
> Let Claude or another AI assistant read and manage your Consibio Cloud projects through the MCP server.
Consibio Cloud has an MCP (Model Context Protocol) server that lets AI assistants — like Claude — work with your projects directly: reading live and historical measurements, checking device status, and managing alarms, all with your own account’s permissions. This server is about *your data*. If you instead want an assistant that can answer support questions from the Consibio documentation, see [Connecting an AI assistant to the Help Center](/integrations/help-center-mcp/) — that one needs no account at all, and the two can be connected side by side. ## What you need [Section titled “What you need”](#what-you-need) * A Consibio Cloud account. * A Consibio API token (a *Bearer token*). See [Consibio Cloud API](/integrations/api/) for how to get one. * An MCP-capable assistant, e.g. Claude (Desktop app or claude.ai). ## Connect Claude Desktop [Section titled “Connect Claude Desktop”](#connect-claude-desktop) 1. Open your Claude Desktop configuration file: * macOS: `~/Library/Application Support/Claude/claude_desktop_config.json` * Windows: `%APPDATA%\Claude\claude_desktop_config.json` 2. Add the Consibio Cloud MCP server, replacing `YOUR_TOKEN` with your API token:
```json
{
"mcpServers": {
"consibio-cloud": {
"type": "http",
"url": "https://mcp.consibio.cloud/mcp",
"headers": {
"Authorization": "Bearer YOUR_TOKEN"
}
}
}
}
```
3. Restart Claude Desktop. The Consibio Cloud tools appear in the tools menu. Other MCP clients work the same way: point them at `https://mcp.consibio.cloud/mcp` (streamable HTTP transport) with an `Authorization: Bearer YOUR_TOKEN` header. ## What the assistant can do [Section titled “What the assistant can do”](#what-the-assistant-can-do) The MCP server exposes the Consibio Cloud API as tools, so the assistant can — within your account’s permissions — for example: * list your projects, devices and elements, * read live values and historical datalog, * check device health and uptime, * create and manage alarms, reports and widgets. Try prompts like *“What’s the current temperature in my greenhouse project?”* or *“Which of my devices have been offline in the last 24 hours?”*. ## Security notes [Section titled “Security notes”](#security-notes) * The assistant acts **as you**: it can only see projects you’re a member of, and its writes are limited by your role. * Treat your API token like a password. Don’t share configs containing it, and revoke it if it leaks. ## Troubleshooting [Section titled “Troubleshooting”](#troubleshooting) * **The tools don’t appear** — check the config file is valid JSON and restart the client. * **Authentication errors** — your token may have expired; generate a new one (see [Consibio Cloud API](/integrations/api/)). Still stuck? Contact .
# Pulling datalogs with the REST API
> Register a service account and pull historical measurements out of Consibio Cloud for a location, using the REST API.
This walks through the most common REST API integration: pulling historical datalogs out of Consibio Cloud on a per-location basis, so you can save them into another system. For the full endpoint reference, see the interactive API documentation: . ## Terminology [Section titled “Terminology”](#terminology) * **Device** (also called a **gateway**) — the physical IoT hardware deployed on site. It communicates with sensors or actuators (like relays, pumps and valves) over a wired connection, and relays data to Consibio Cloud over Wi-Fi, cellular or satellite. * **Element** — a sensor or actuator value. One device can provide values for several elements. * **Location** — a group of devices and elements at a physical site. * **Project** — the top-level container for devices, elements and locations. User access and authorization is managed at the project level. ## One-time setup [Section titled “One-time setup”](#one-time-setup) ### Register a service account [Section titled “Register a service account”](#register-a-service-account) To call the API, you need a user account with access to the resources you want to read. You can use your personal Consibio Cloud account for testing, but for a real integration you should register a dedicated service account — for example `service-account@your-domain.com` — by signing up at . You’ll need to verify the account, so use an email address you can receive the verification email at. ### Grant the service account access to the project [Section titled “Grant the service account access to the project”](#grant-the-service-account-access-to-the-project) While logged in as a user who already has access to the project: 1. Open the **Users** view from the main menu. 2. Select **Add user to project**. 3. Enter the service account’s email and choose a role — **Viewer** is enough if the account will only read data. 4. Select **Send invite**. The service account now has access to the project at the chosen role. ### Get the project ID [Section titled “Get the project ID”](#get-the-project-id) Open the project in Consibio Cloud — the project ID is in the browser’s address bar:
```plaintext
https://v3.consibio.cloud/projects//devices
```
Save this ID; you’ll use it in every API call for this project. ## Pulling a datalog [Section titled “Pulling a datalog”](#pulling-a-datalog) ### 1. Authenticate [Section titled “1. Authenticate”](#1-authenticate) Request a token from the login endpoint with the service account’s credentials:
```bash
curl -s -X POST https://api.v2.consibio.cloud/login \
-H 'Content-Type: application/json' \
-d '{"username":"service-account@your-domain.com","password":"secret123"}'
```
This returns:
```json
{
"status": "ok",
"payload": {
"token": "your_access_token_here",
"user_id": "your_user_id_here",
"email": "service-account@your-domain.com",
"expires": 1679003040
}
}
```
Include the token in the `Authorization` header of every subsequent request:
```plaintext
Authorization: Bearer
```
### 2. List locations in the project [Section titled “2. List locations in the project”](#2-list-locations-in-the-project)
```bash
curl -s https://api.v2.consibio.cloud/projects//locations \
-H 'Authorization: Bearer '
```
This returns the locations in the project, keyed by location ID:
```json
{
"status": "ok",
"payload": {
"": {
"name": "Consibio Headquarter",
"location": {"latitude": 56.208, "longitude": 10.217},
"type": "sewer-manhole",
"parameters": {"": ""}
}
}
}
```
### 3. Request datalogs for a location [Section titled “3. Request datalogs for a location”](#3-request-datalogs-for-a-location) For each location ID, request everything related to that location over a time range:
```bash
curl -s "https://api.v2.consibio.cloud/projects//locations//all?from_time=&to_time=" \
-H 'Authorization: Bearer '
```
`from_time` and `to_time` are Unix timestamps in seconds. The response includes the location’s devices, elements, alarms, virtual sensors, and a `datalogs` object keyed by element ID:
```json
{
"status": "ok",
"payload": {
"datalogs": {
"element_id_1": [
{"t": 1751650800, "v": 10.2},
{"t": 1751651100, "v": 15.1}
]
}
}
}
```
Use the `datalogs` object for historical data over the requested period, or the `elements` object for each element’s most recent measurement. ## Next steps [Section titled “Next steps”](#next-steps) For an overview of authentication options and the full endpoint list, see [Consibio Cloud API](/integrations/api/). To try this out without real hardware, see [Testing the REST API with a demo project](/integrations/testing-the-rest-api-with-a-demo-project/). ## Support [Section titled “Support”](#support) Questions about the REST API? Contact .
# Pushing data to Azure Event Hubs
> Forward your project's measurements from Consibio Cloud to an Azure Event Hub instance as they arrive.
Consibio Cloud can push your project’s data to an [Azure Event Hub](https://azure.microsoft.com/en-us/products/event-hubs) instance as it arrives. Every time new values are logged in the project — from devices, integrations or virtual sensors — Consibio Cloud sends a message to your Event Hub, so you can process the data in your own systems in near real-time. ## What you need [Section titled “What you need”](#what-you-need) * A project in Consibio Cloud where you have the **admin** or **owner** role. * An Event Hub instance in your Azure subscription. * The **connection string** for the Event Hub. Follow Microsoft’s guide [Get an Event Hubs connection string](https://learn.microsoft.com/en-us/azure/event-hubs/event-hubs-get-connection-string) to obtain it. ## Setting up the integration [Section titled “Setting up the integration”](#setting-up-the-integration) 1. Open your project in Consibio Cloud. 2. In the left menu, select **More**, open the **Settings** section and select **Integrations**. 3. Select **Add new integration**. A panel opens with the new integration. 4. Give the integration a name, and make sure **Integration type** is set to **Azure Event Hub**. 5. Save your changes. ## Saving the connection string [Section titled “Saving the connection string”](#saving-the-connection-string) The connection string is stored as a secret: the dashboard only lets you update it — it is not displayed again after saving. Only project **admins** and **owners** can edit it. 1. Open the integration from the **Integrations** view. 2. Under **Connection string**, select **Edit secret**. 3. Paste the connection string from Azure and save. Consibio Cloud starts pushing new values to your Event Hub right away. Note that only values logged *after* the integration is set up are pushed — historical data is not sent. To pull historical data, use the [REST API](/integrations/api/) instead. ## The standard payload [Section titled “The standard payload”](#the-standard-payload) Each message sent to your Event Hub is a JSON document with all the numeric values from one value event:
```json
{
"time": 1756106468,
"datetime": "2025-08-25T07:21:08Z",
"project_id": "your_project_id",
"values": {
"element_id_1": 21.5,
"element_id_2": 7.2
}
}
```
* `time` — when the values were measured, as a Unix timestamp in seconds. * `datetime` — the same time as an ISO 8601 string in UTC. * `project_id` — the ID of your Consibio Cloud project. * `values` — the measured values, keyed by element ID. Only numeric values are forwarded; text values are left out. To map element IDs to your elements, open the **Elements** view under **Settings**, or list the project’s elements with the [REST API](/integrations/api/). ## Custom payloads [Section titled “Custom payloads”](#custom-payloads) If you need messages in a different format — for example to match an existing ingestion pipeline — Consibio Cloud also supports custom payload templates, where you control the exact structure of each message. Reach out to to have custom payloads set up for your project. ## Troubleshooting [Section titled “Troubleshooting”](#troubleshooting) * **No messages arrive in the Event Hub**: check that the connection string is correct and includes the `EntityPath` of your Event Hub, and that new values are actually being logged in the project. * **Some values are missing**: only numeric values are pushed — text values are not included in the standard payload. If you are stuck, contact .
# Testing the REST API with a demo project
> Try the Consibio Cloud REST API against simulated data, without needing real hardware.
If you don’t have any Consibio devices yet but still want to test an integration with our API, you can do it using a demo project with simulated data. ## Set up the demo project [Section titled “Set up the demo project”](#set-up-the-demo-project) 1. Sign up for a new account at , using the email address you want to authenticate with (for example a service account). You’ll need to verify the email address, so use one you have access to. 2. Sign in at with the new account. 3. A demo project with simulated data is created automatically the first time you sign in. Open it from the project overview. 4. The project shows mock data, such as a simulated temperature curve. Copy the project ID from the browser’s address bar — you’ll need it for API calls:
```plaintext
https://v3.consibio.cloud/projects//devices
```
## Test the API [Section titled “Test the API”](#test-the-api) With the demo project’s ID, the normal workflow for retrieving telemetry datalogs is: 1. **Authenticate** — request a token from the login endpoint using the new account’s credentials:
```plaintext
POST https://api.v2.consibio.cloud/login
```
2. **List elements** (if you don’t already know the element IDs — the unique tags associated with each measurement):
```plaintext
GET https://api.v2.consibio.cloud/projects//elements
```
3. **Request datalogs** for the element IDs you want:
```plaintext
GET https://api.v2.consibio.cloud/projects//datalog?elements=;&from_time=&to_time=
```
For the full request/response details, see the interactive API docs at , or the walkthrough in [Pulling datalogs with the REST API](/integrations/pulling-datalogs-with-the-rest-api/). ## Support [Section titled “Support”](#support) Questions about testing the API? Contact .